Figure 1.
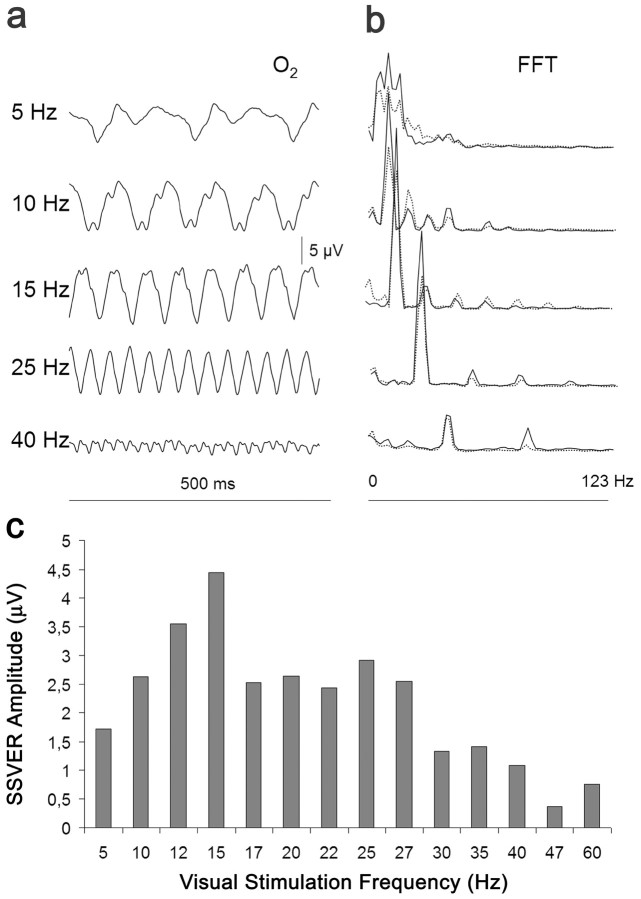
Effect of visual stimulation at different frequencies on the amplitude of the SSVER. a, SSVER recordings of one representative subject at the right occipital lead (O2). b, FFT of this individual's SSVERs and grand average of 16 normal subjects (dotted line). c, Average of the mean values of the amplitude of the FFT fundamental frequency of the SSVER recorded at the three occipital leads (Oz, center; O1, left; O2, right) at the different stimulation frequencies. The amplitude of the occipital SSVER, expressed in microvolts, reached a maximum at ∼15 Hz and then fell with a plateau up to 27 Hz, declining at higher frequencies.

