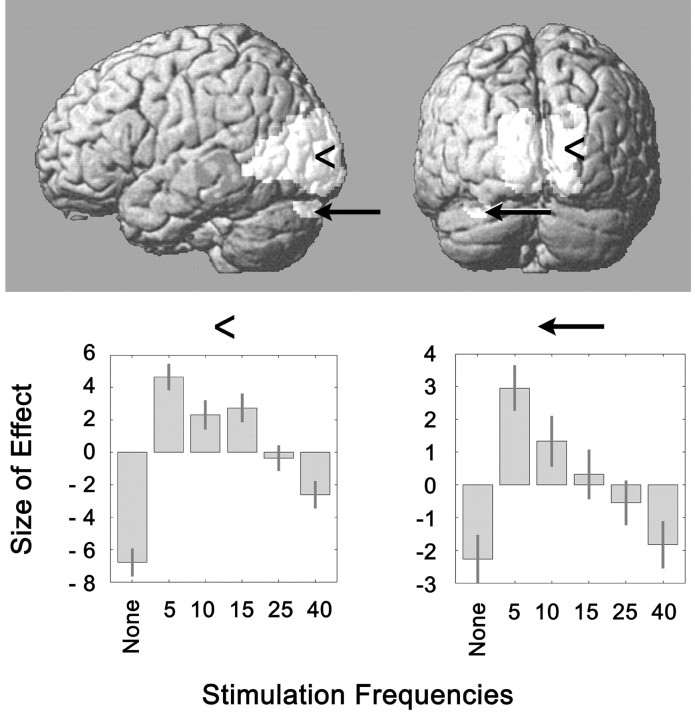
Figure 5.
Regions activated during 5 Hz visual stimulation compared with the rest condition, projected on a rendered image of the human brain. The position of the voxel of greatest activation is indicated in the occipital lobe (x, 14; y, -78; z, 6; arrowheads) and the cerebellum (x, -32; y, -88; z, -26; arrows). The charts at the bottom depict the effect size of the parameter estimates in the voxels of greatest activation at 5 Hz stimulation for stimulation at all five frequencies used in the experiment. Note that the patterns of occipital and cerebellar activation are quite similar, and that the voxels maximally activated in each area are crossed.

