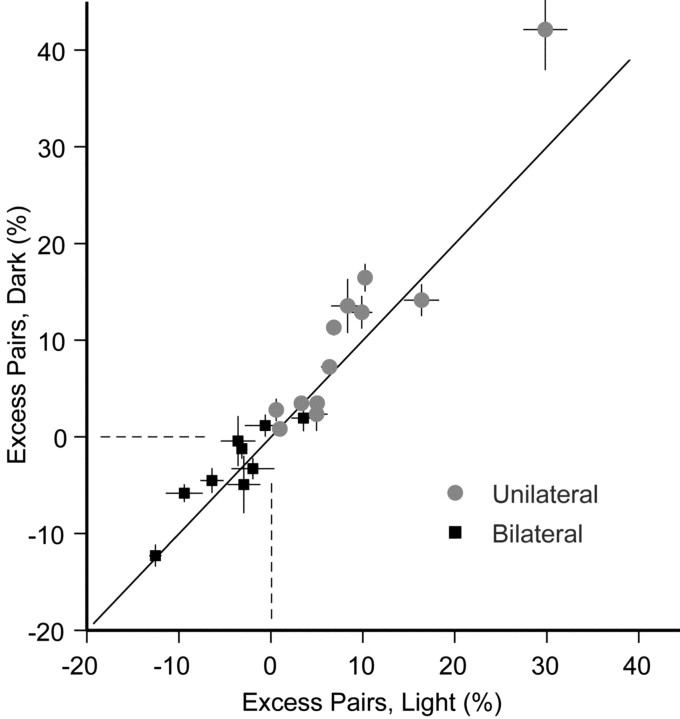
Figure 4.
Correlation for the population in the light and dark. Excess pair counts, expressed as a percentage relative to baseline, for same-sided cells (unilateral; gray) and opposite-sided cells (bilateral; black). The values in the light are plotted along the abscissa and in the dark along the ordinate. Dashed lines indicate 0 excess.

