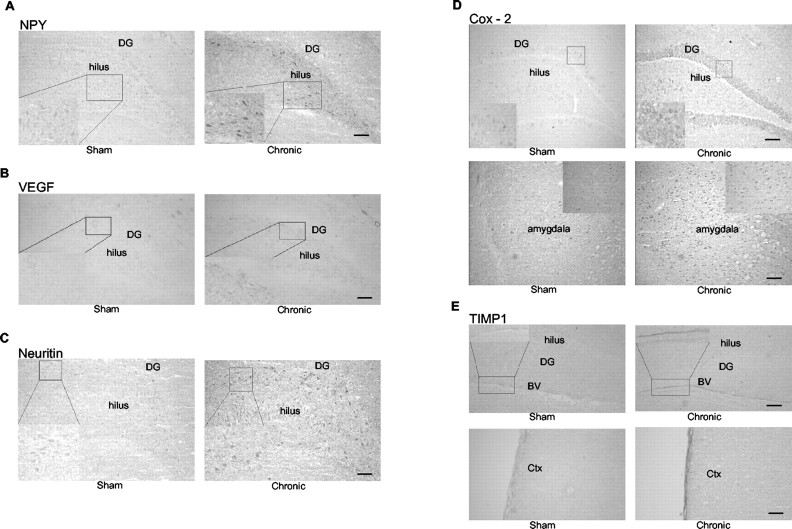
Figure 7.
Immunohistochemical analysis demonstrating ECS regulation of corresponding protein levels for several genes. Immunohistochemistry was performed on sections from chronic ECS or sham animals using fresh frozen cryocut sections. A-C, E, Representative images are shown from chronic ECS (6 hr after ECS) for NPY (A), VEGF (B), neuritin (C), and TIMP-1 (E). D, Cox-2 immunohistochemistry was 2 hr after ECS. D, Maximal increases in Cox-2 protein were observed in the DG and amygdala and shown with higher power magnification in the inset. E, TIMP-1 expression in blood vessel (BV) and outer layer of cerebral cortex corresponds to regions of mRNA regulation. Upregulation of NPY, VEGF, and neuritin was most evident in the hilus and is shown with magnified insets. Scale bars: A-C, 25 μm; D, E, 50 μm.

