
Figure 3.
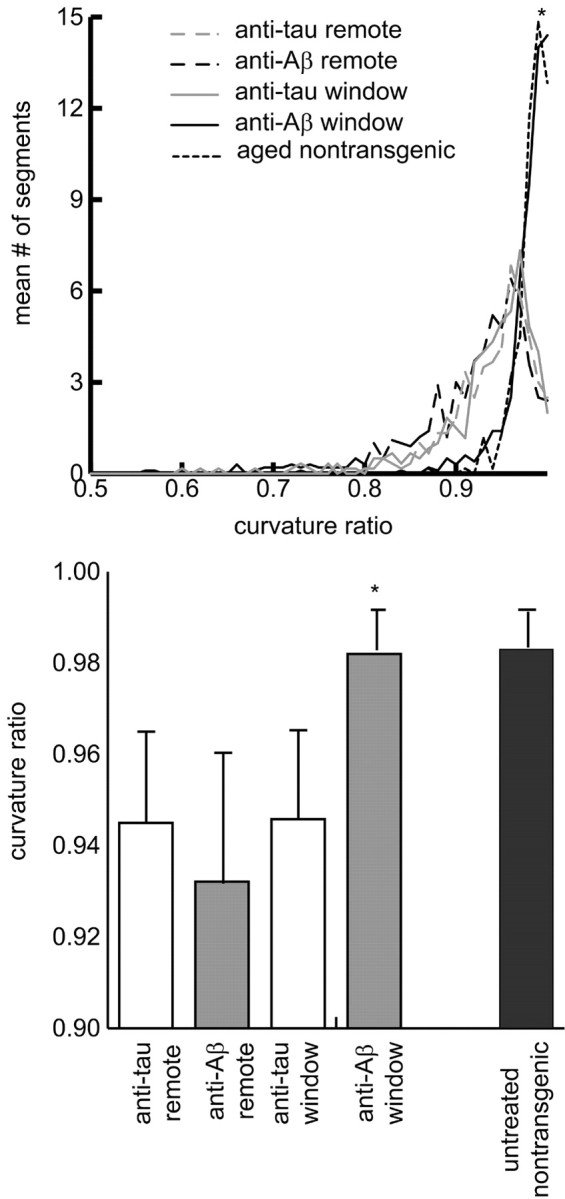
Comparison of curvature ratios from different experimental conditions. Top, Mean curvature ratio histogram for each experimental condition. Bottom, Comparison of curvature ratios for the different experimental conditions. The values are the medians ± median absolute deviations across animals for each condition.