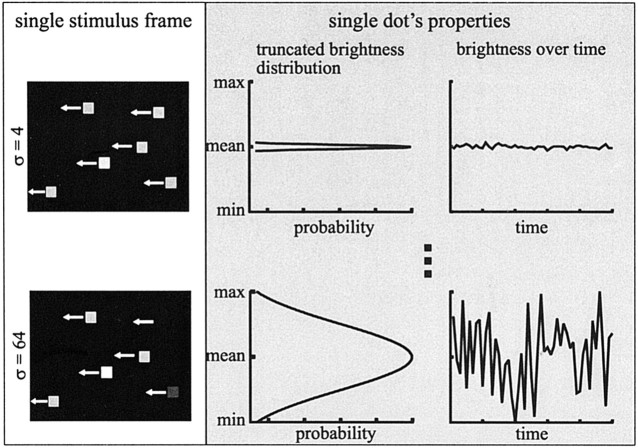
Figure 1.
Visual stimuli for the smallest (σ = 4; top) and the largest (σ = 64; bottom) noise level. On the left, the same frame of the motion sequence is shown. For the first frame, a number of dots are placed randomly on the screen, and in subsequent frames the dots are shifted in the preferred direction of the H1 cell (indicated by the arrows). As shown, each dot has its own brightness. Properties of a sample dot are shown on the right. The noise sequence applied to this dot during presentation was made up of randomly drawn brightness values drawn from a Gaussian distribution centered at the mean brightness (127 on the eight-bit scale) and a SD of σ = 4, 8, 16, 32, or 64, defining the noise level (shown for σ = 4 and 64). This distribution was truncated at mean ± 2σ. Although the brightness variations over time are quite small (top), modulations covering the full brightness range are possible at the largest noise level (σ = 64).

