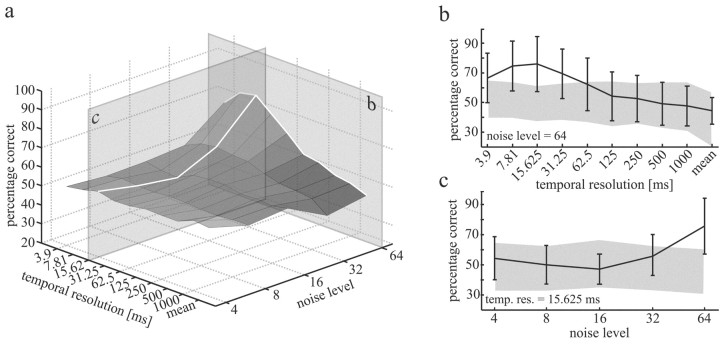
Figure 4.
Averaged discrimination of reference and test responses as a function of the noise level added to the stimuli and the temporal resolution of the measure of discrimination as developed by Victor and Purpura (1997). Data are based on a set of 11 H1 neurons recorded in 11 different flies. Transects b and c are shown in more detail in b and c. b, Mean discrimination of reference and test responses at the maximum noise level (σ = 64) in dependence of the temporal resolution was used for data analysis. The error bars show the SD of percentage correct decisions across the 11 cells. The shaded area represents the domain of uncertainty (see Materials and Methods). c, As in b, but the noise amplitude was varied at the “best” temporal resolution (15.625 msec).

