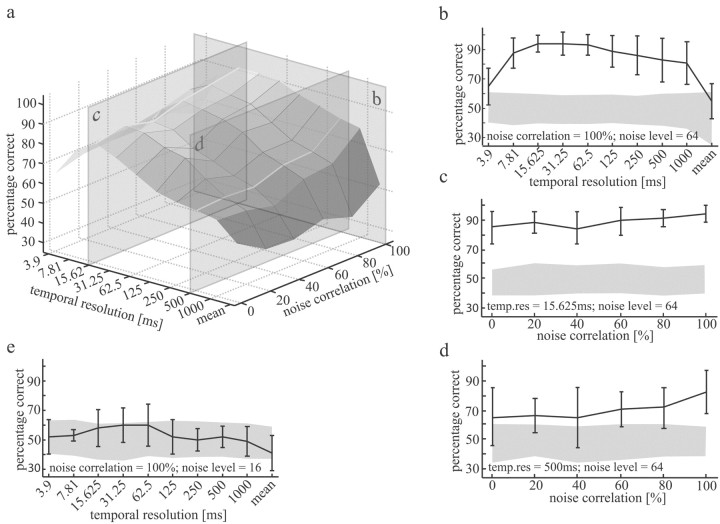
Figure 5.
Mean discrimination performance as a function of the noise correlation and the temporal resolution of the measure of discrimination as developed by Victor and Purpura (1997). The experiments were performed at the maximum noise level (σ = 64). The average performance is based on 10 H1 recordings in another set of 10 different flies than those on which the data shown in Fig. 4 are based. The transections refer to sections shown in b-d. b, The average discrimination performance at 100% noise correlation expressed in percentage correct decisions as a function of the temporal resolution was used for data analysis. Error bars show the SD across the 10 H1 recordings. The shaded area shows the domain of uncertainty (see Materials and Methods). c, Same data as in b but the noise correlation was varied at the “best” temporal resolution. The temporal resolution was 15.625 msec. d, Same data as in c but at a temporal resolution used for data analysis of 500 msec. e, Mean discrimination performance at 100% noise correlation and a noise level of σ = 16 as a function of the temporal resolution for four H1 recordings of four different flies. The error bars represent the SD of performance levels. Shown in gray is the domain of uncertainty, which represents the performance levels that are likely to be the result of internal noise and photon noise but not of the added external noise.

