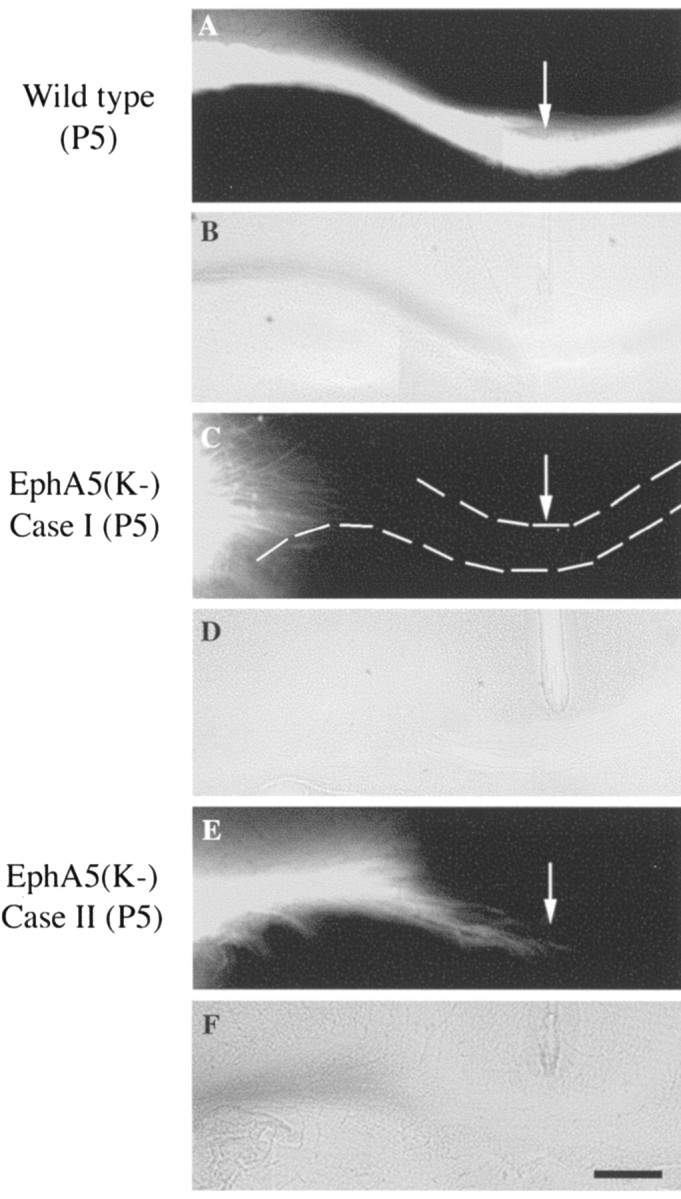
Figure 6.

Analysis of callosal projections in developing (P5) mouse brains. DiI solutions were injected into the S1 area of P5 mice. A, B, Fluorescence (A) and bright-field (B) photomicrographs of callosal fibers in a wild-type control mouse. C-F, Fluorescence (C, E) and bright-field (D, F) photomicrographs of callosal fibers of two transgenic mice. Scale bar, 100 μm.
