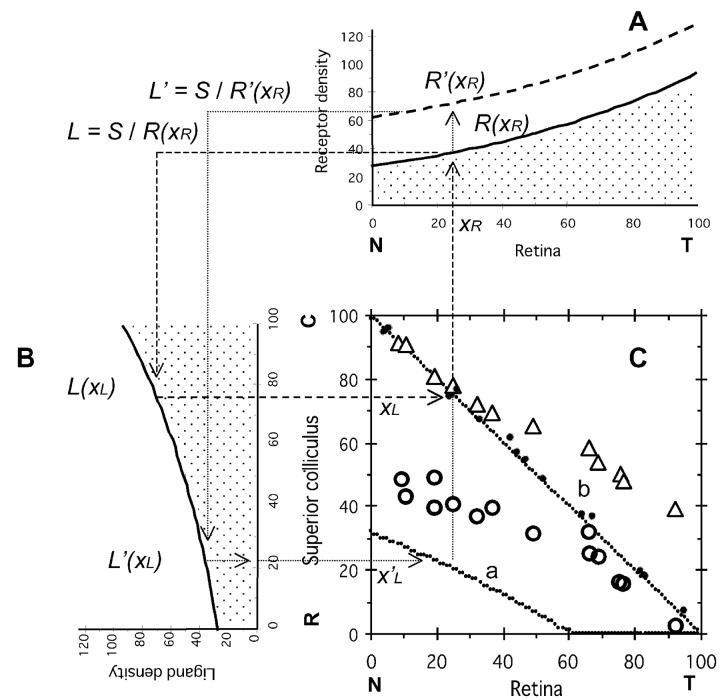
Figure 1.
Topographic mapping of the retinocollicular projection in wild-type mice and mice with increased EphA3. S = 2500; a = 1/80; and RE = 36. C, R, Caudal and rostral superior colliculus (SC), respectively; N, T, nasal and temporal retina, respectively. A, Eph receptor density of the normal retinal ganglion cells (EphA3-; thick line R(xR) = S1/2 exp[a (xR - 50)]) and the retinal ganglion cells with increased EphA3 receptor (EphA3+; broken line; R(xR) = S1/2 exp[a (xR - 50)] + RE) on the retina. B, Ligand ephrin density in the SC. L(xL) = S1/2 exp[a (xL - 50)]. C, Topographic maps of the elevated retinal ganglion cells EphA3+ (a) and normal retinal ganglion cells EphA3- (b). xR (percent nasotemporal axis of retina) is the starting point of axonal projection, and xL (percent rostrocaudal axis of the SC) is the arrival point. Topographic map of the retinal ganglion cells (b) is on the line xR + xL = 100. Solid circles, Actual data of the retinocollicular projection of wild-type mice by Brown et al. (2000); open circles, open triangles, actual data of the retinocollicular projection of knock-in mice with EphA3+ and EphA3- retinal axons (Brown et al., 2000), respectively.

