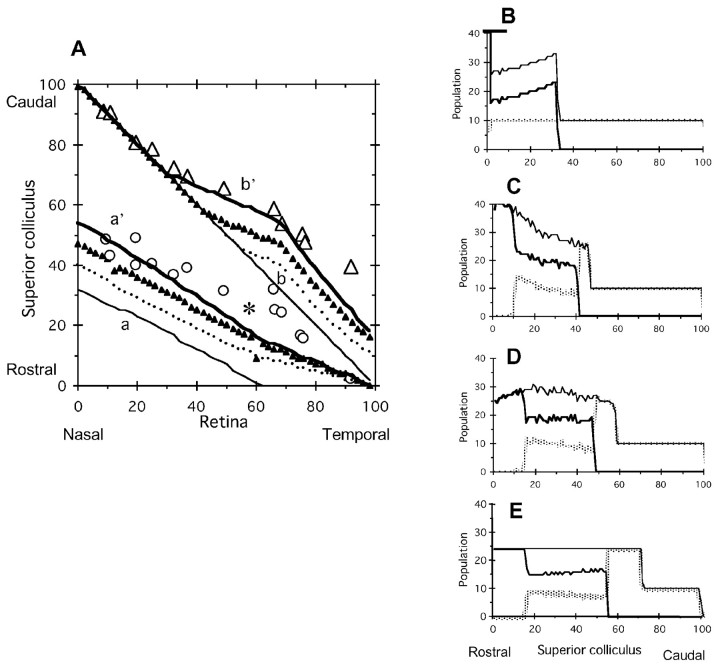
Figure 2.
Time course of competition of axon terminals on the SC. Critical population density nC = 24, and RE = 36. A, Topographic map. a to a′, Projection maps of EphA3+ axons; b to b′, projection maps of EphA3- axons. Thin line, dotted line, triangles, thick line, Initial mapping, 5 × 10⁴ steps of competition, 105 steps, and 5 × 10⁵ steps, respectively; open circles, open triangles, experimental results of EphA3+ and EphA3- retinal axons by Brown et al. (2000), respectively. B-E, Population distributions of EphA3+ and EphA3- retinal axons on the SC are on the initial map (B), 5 × 10⁴ steps of competition (C), 105 steps (D), and 5 × 10⁵ steps (E). Thick, gray, thin lines, EphA3+ axons, EphA3- retinal axons, and their sum, respectively. Value of the peak truncated in B is 398.

