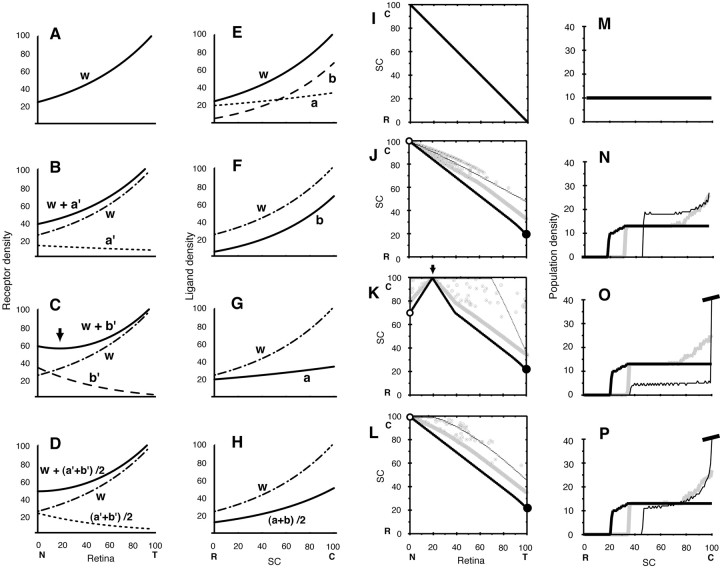
Figure 8.
Simulations for knock-out mice with upregulation of Eph in the retina attributable to disrupted ephrins. A-D, Graded receptor densities in the retina used for computer simulations. Dotted-dashed line (line w), 1.224 f(xR), the same as line w in A (for comparison). A, Receptor density of wild-type mouse (line w), 1.224 f(xR). B, Solid line, Receptor density of A2-/- (line w + a′), 1.224 f(xR) + 0.45 fa(100 - xR); dotted line (line a′), 0.45 fa(100 - xR). C, Solid line, Receptor density of A5-/- (line w+b′),1.224f(xR)+0.6fb(100-xR);arrow, position of a trough; dotted line (line b′), 0.6 fb (100-xR). D, Solid line, Receptor density of heterozygote A2+/- and A5+/-, line w + (a′+ b′)/2, 1.224 f(xR) + 1/2 [0.6 fa(100 - xR) + 0.45 fb(100 - xR)]. Dotted line, (a′+ b′)/2, 1/2 [0.6 fa(100 - xR) + 0.45 fb(100 - xR)]. E-H, Graded ligand densities in the SC used for computer simulations. Dotted-dashed line, 1.224 f(xL) the same of line w in E (for comparison). E, Solid line (line w), Total ligand density of lines a and b, 1.224 f(xL); dotted line (line a), 1.224 fa(xL); broken line (line b), 1.224 fb(xL). F, Ligand density of A2-/-, 1.224 fb(xL). G, Ligand density of A5-/-, 1.224 fa(xL). H, Solid line, Ligand density of heterozygote A2+/- and A5+/-, line (a + b)/2, 1/2 [1.224 fb(xL) + 1.224 fa(xL)]. In the above-mentioned explanation, the following functions are used: f(x) = 20 exp(x/ 70); fa(x) = 16 exp(x/180); and fb(x) = f(x) - fa(x). I-L, Topographic maps by computer simulations. Thin, gray, thick lines, Initial mapping, 5 × 10⁶ steps of competition, and 2 × 10⁷ steps, respectively; open, solid circles, projected positions of nasal and temporal retinal axon terminals on 2 × 10⁷ steps. I, Map by the ligand density of E (line w) and the receptor density of A (line w). The map did not change during competition steps. J, Map by the ligand density of F (line b) and the receptor density of B (line w + a′). Open circles, xL = 100. K, Map by the ligand density of G (line a) and the receptor density of C (line w + b′). Open circles, xL = 71; solid circle, xL = 21; arrow, xR = 20. L, Map of heterozygote by the ligand density of H [solid line, line (a + b)/2] and the receptor density of figure D [solid line, line w + (a′+ b′)/2]. Open circles, xL = 100; solid circles, xL = 21. M-P, Distribution of population densities of axon terminals on the SC. Thin, gray, thick solid lines, Initial mapping, 5 × 10⁶ steps of competition, and 2 × 10⁷ steps, respectively. M, Distribution did not change during competition steps. N, Distribution changed during competition steps. O, Value of the truncated peak of the distribution of the initial mapping was 703. P, Value of the truncated peak of the distribution of the initial mapping was 222. C, R, Caudal and rostral SC, respectively; N, T, Nasal and temporal retina, respectively.

