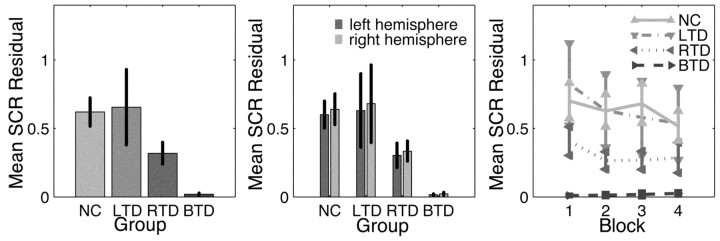
Figure 3.
Group SCR responses to experimental stimuli (means ± SEM). Left, Group SCR response to all emotional stimuli (residuals from group-wise habituation model) across all recording blocks (two subliminal and two supraliminal) for all experimental groups. Middle, Decomposition of the overall SCR response shown in the left panel with regard to hemispheric stimulation. No significant differences were found between the hemispheres. Right, Mean SCR response for all experimental groups in all recording blocks. This is a decomposition of the data in the left panel. Normal controls and unilateral temporal patients show a slight (nonsignificant) decrease in mean responsiveness in the course of the experiment.

