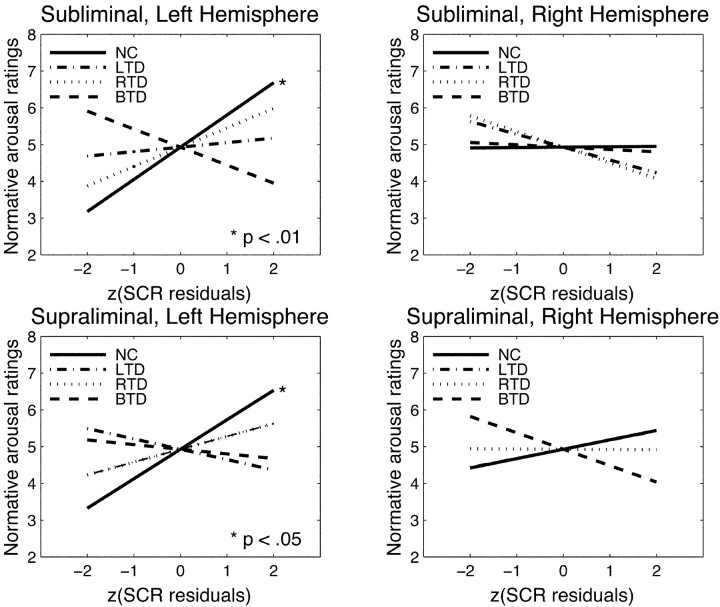
Figure 4.
Graphs of the regression lines for normative arousal ratings versus group SCRs for different experimental conditions (mode of processing, stimulated hemisphere). Z-transformed values are used for these plots because of different variances in the experimental groups, thus allowing a visual comparison of the plots on a uniform scale. The SCRs of normal controls significantly predict normative arousal ratings when the stimuli are presented into the left hemisphere but not into the right. None of the patient groups' SCRs show a significant relationship, although right temporal patients perform better (nonsignificant) under left hemispheric stimulation than left temporal patients. Right hemisphere stimulation does not lead to any significant relationship between SCRs and normative ratings. (Normal controls and bilateral temporal patients have the same regression line in the bottom right graph, and, thus, data from normals conceal those from the bilateral patients.)

