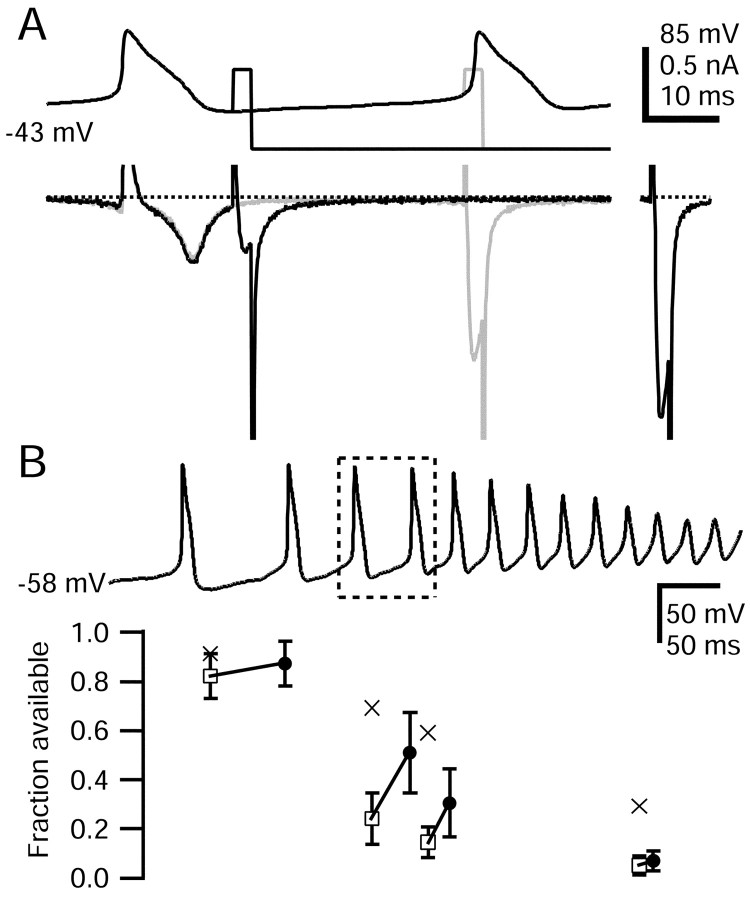
Figure 10.
Recovery from fast inactivation during interspike interval in the capsaicin response waveform. A, Top, Voltage protocol used to measure TTX-R sodium channel recovery from fast inactivation in the interval between the third and fourth action potentials (outlined in B). For comparison, the TTX-R sodium current available after removal of all fast inactivation by a 30 msec step to -100 mV applied near the peak of the AHP is shown at right (69% of initial current). Dotted lines show zero current level. Large inward tail currents flowing during repolarizations to -100 mV have been truncated, as have outward currents during the action potential upstroke and the test step onset. The internal solution contained the following (in mm): 130 NMDG, 120 aspartate, 15 NaCl, 1.8 MgCl2, 9 EGTA, 9 HEPES, 4 MgATP, 14 Tris-creatine PO4, and 0.3 Tris-GTP, pH 7.4 (with 7 mm CsOH). The external solution contained the following (in mm): 50 NaCl, 100 TEA-Cl, 4 CsCl, 2 CaCl2, 2 MgCl2, 0.03 CdCl2, 10 glucose, and 10 HEPES, pH 7.4 (with TEA-OH). B, Average fraction available TTX-R sodium current is shown throughout the capsaicin response. Available current ∼5 msec after a spike (open squares) and later in interspike interval (filled circles). Error bars indicate SD. Lines connect values during the same interspike interval. Reduction in TTX-R current availability caused by slow inactivation is shown in crosses (error bars omitted).

