
Figure 5.
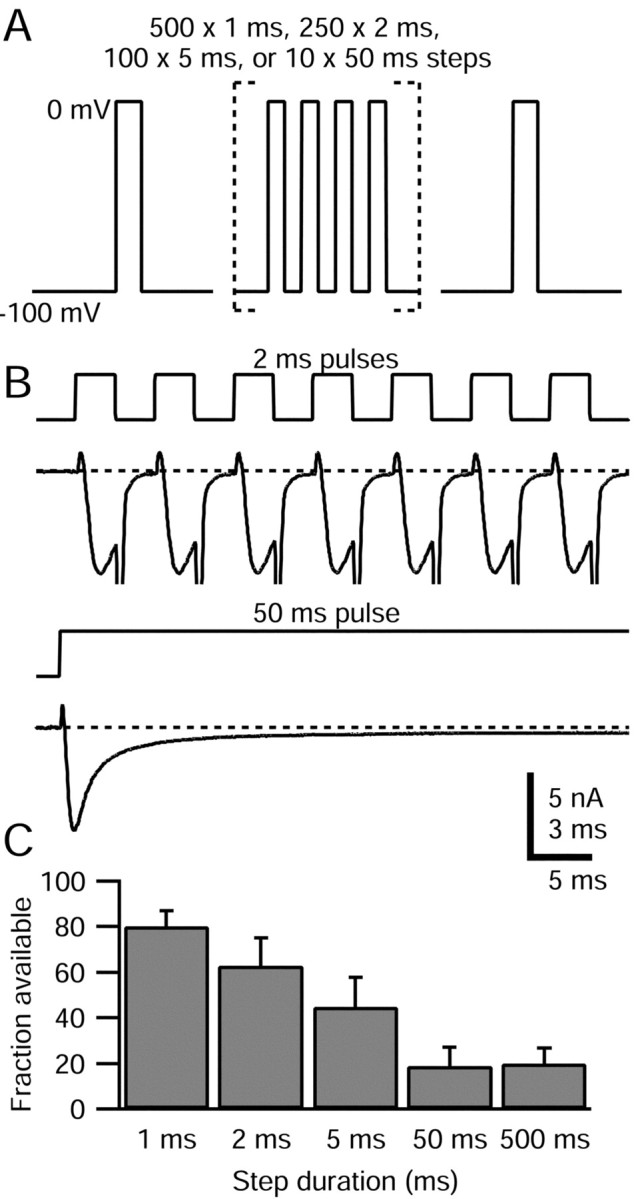
TTX-R sodium channel slow inactivation elicited by steps of varying duration. A, Schematic of voltage protocol: a train of 1, 2, 5, and 50 msec pulses to 0 mV was applied, with a total duration of 500 msec spent at 0 mV in each case. A test step to 0 mV after the train (preceded by 15 msec at -100 mV) assayed TTX-R sodium channel slow inactivation. The interpulse interval was 2 msec for the 1 and 2 msec pulse trains and 5 msec for the 5 and 50 msec pulse trains. B, Comparison of TTX-R sodium currents flowing during 2 and 50 msec pulses. The first seven pulses during the 2 msec train and the first 50 msec pulse are shown. Large inward tail currents during repolarizations were truncated. The dotted line indicates zero current level. Note different time scales: bar corresponds to 3 msec of 2 msec pulse train and 5 msec of 50 msec pulse train. The internal solution contained the following (in mm): 130 NMDG, 120 aspartate, 15 NaCl, 1.8 MgCl2, 9 EGTA, 9 HEPES, 14 Tris-creatine PO4, 4 MgATP, and 0.3 Tris-GTP, pH 7.4. The external solution contained the following (in mm): 50 NaCl, 100 TEA-Cl, 4 CsCl, 2 CaCl2, 2 MgCl2, 0.03 CdCl2, 10 glucose, and 10 HEPES, pH 7.4 (with TEA-OH). C, Average available TTX-R sodium current (second test step current normalized to test step current applied before pulse train) for different pulse durations. Error bars indicate SD.