
Figure 1.
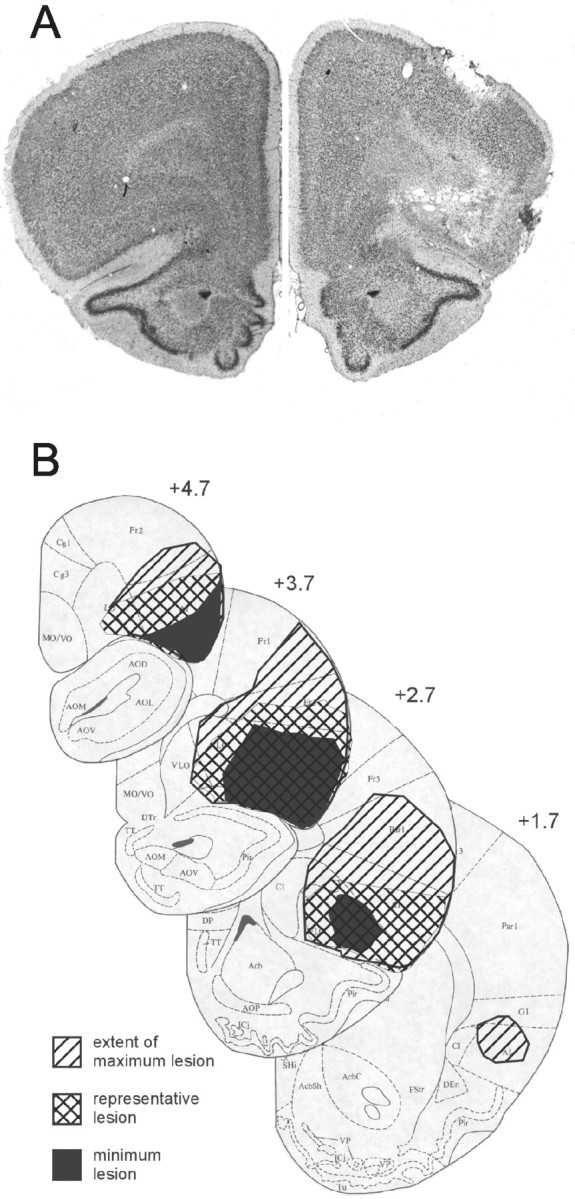
A, Representative neurotoxic (right hemisphere) and sham (left hemisphere) lesions of the OFC. B, Extents of minimum, maximum, and representative OFC lesions at various distances anterior to bregma.
Official websites use .gov
A
.gov website belongs to an official
government organization in the United States.
Secure .gov websites use HTTPS
A lock (
) or https:// means you've safely
connected to the .gov website. Share sensitive
information only on official, secure websites.
A, Representative neurotoxic (right hemisphere) and sham (left hemisphere) lesions of the OFC. B, Extents of minimum, maximum, and representative OFC lesions at various distances anterior to bregma.