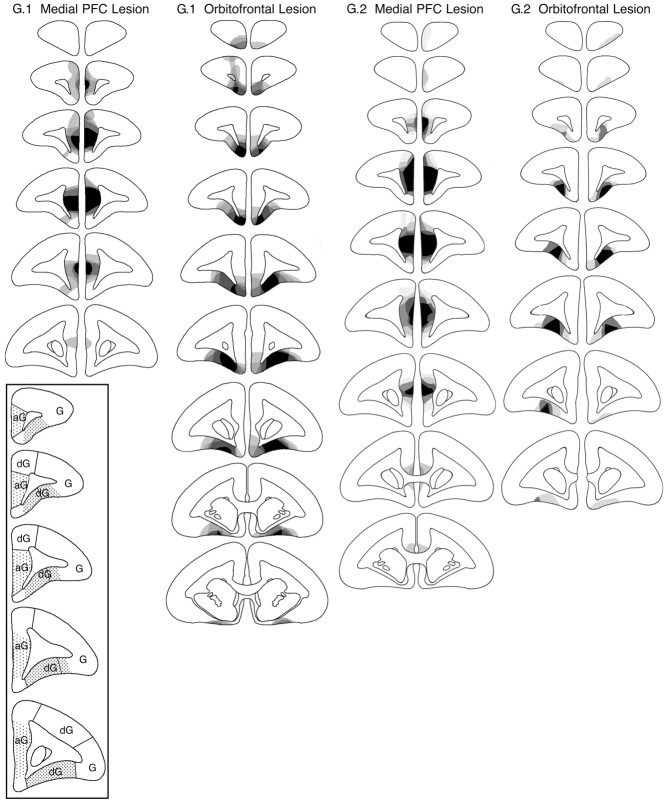
Figure 1.
Schematic diagrams of a series of coronal sections through the frontal lobe of the marmoset illustrating the site of the lesion of the medial PFC and orbitofrontal lesion of group 1 (G.1) in experiments 1, 2, and 4 and group 2 (G.2) in experiments 3 and 4. The different levels of shading, ranging from solid black to pale gray, represent the areas of cortex that were damaged in all monkeys, in all monkeys but one, etc., to just one monkey, respectively. The distribution of granular (G), dysgranular (dG), and agranular (aG) regions of cortex within the frontal lobes of the marmoset are illustrated in the series of coronal sections depicted in the inset. The frontal pole is granular throughout. The shaded regions on each coronal section within the inset represent the regions on the orbital surface and the medial wall that were the targets for the orbitofrontal and medial PFC lesions, respectively.

