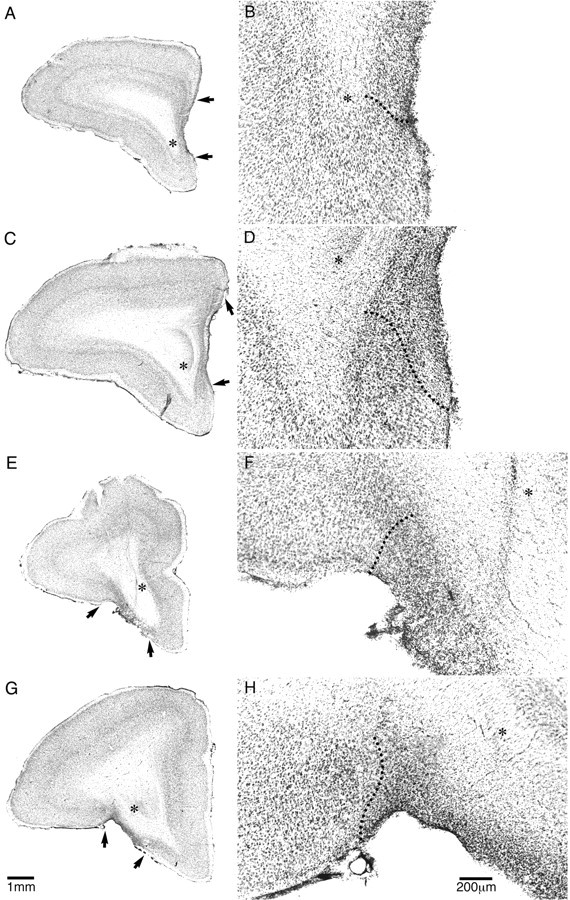
Figure 2.

Low-power (A, C, E, G) and high-power (B, D, F, H) photomicrographs of cresyl fast violet-stained coronal sections through rostral (A, B, E, F) and intermediate (C, D, G, H) levels of the frontal lobe taken from a representative marmoset from the medial PFC (A-D)- and orbitofrontal (E-H)-lesioned groups. The extensive cell loss in the lesioned areas is in stark contrast to the dense layering of neurons seen in the adjacent intact areas. In addition, the loss of orbitofrontal tissue in the orbitofrontal-lesioned monkey (E, G) is in contrast to the intact orbitofrontal cortex in the medial PFC-lesioned monkey (A, C) and vice versa. The arrows in A, C, E, and G and the dotted lines in B, D, F, and H mark the border(s) of the lesion. The asterisks mark the same position in A, C, E, and G as they do in B, D, F, and H, respectively.
