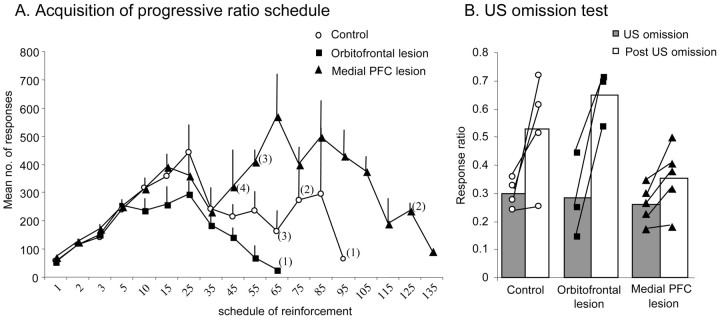
Figure 5.
A, Mean ± SEM number of responses at each level of the progressive-ratio schedule for the control (n = 4), orbitofrontal-lesioned (n = 3), and medial PFC-lesioned (n = 5) groups. Numbers on the x-axis reflect the total numbers of responses required at each level to receive primary reinforcement. Numbers in parentheses indicate the numbers of animals remaining in each group at each level of the schedule. B, The ratio of response rates on the US omission and post-US omission phases relative to the pre-US omission phase [e.g., US omission/(US omission + pre-US omission)] for the control, orbitofrontal, and medial PFC-lesioned groups. A score of 0.5 indicates that responding was equivalent to the pre-US omission phase. Each symbol represents the ratio score of an individual animal.

