
Figure 4.
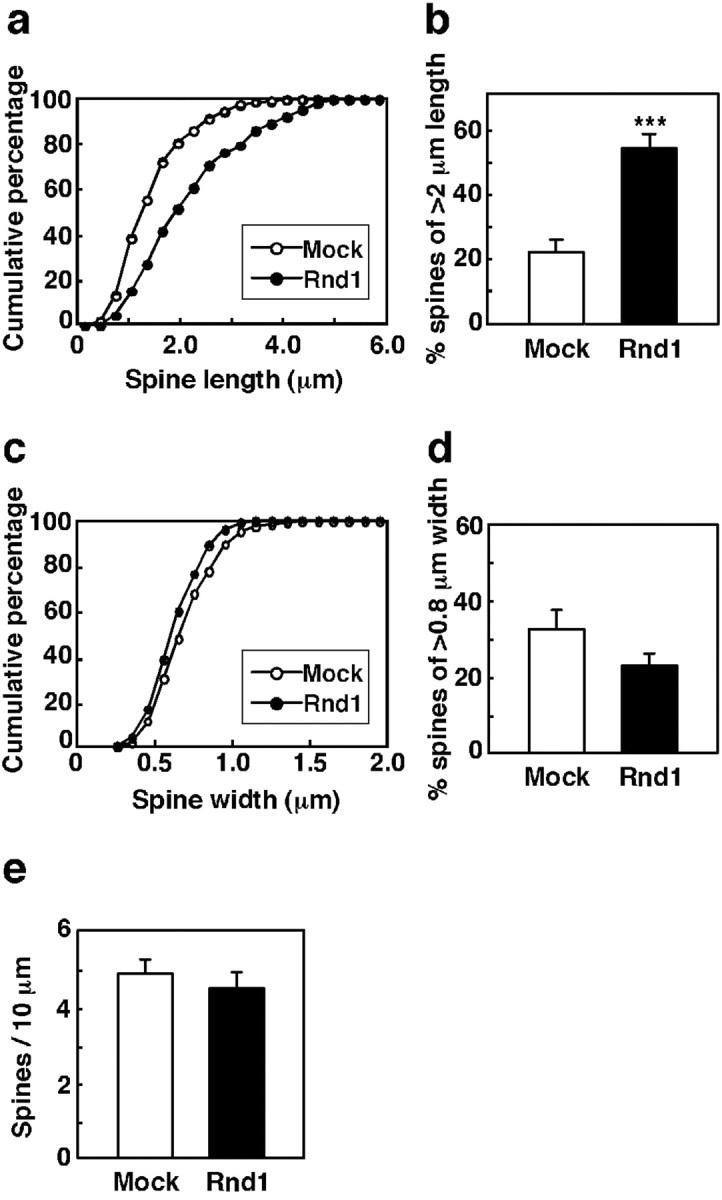
Quantification of dendritic spine morphology of transfected neurons. a, b, Cumulative distribution of spine length of mock- (○) or Myc-Rnd1- (•) transfected neurons (a) and the percentage of spines of >2 μm length in the same population (mock, □; Myc-Rnd1, ▪) (b). c, d, Cumulative distribution of head width of mock- (○) or Myc-Rnd1- (•) transfected neurons (c) and the percentage of spines of >0.8 μm width in the same population (mock, □; Myc-Rnd1, ▪) (d). e, The number of spines of mock- (□) or Myc-Rnd1- (▪) transfected neurons was counted, and the spine density was calculated (spines/10 μm dendrite). Myc-Rnd1-transfected neurons had significantly longer spines than mock-transfected neurons (***p < 0.0005; Student's t test), but there were not significant differences in spine width and density (p > 0.05; Student's t test). The data are the means ± SE.