FIGURE 3:
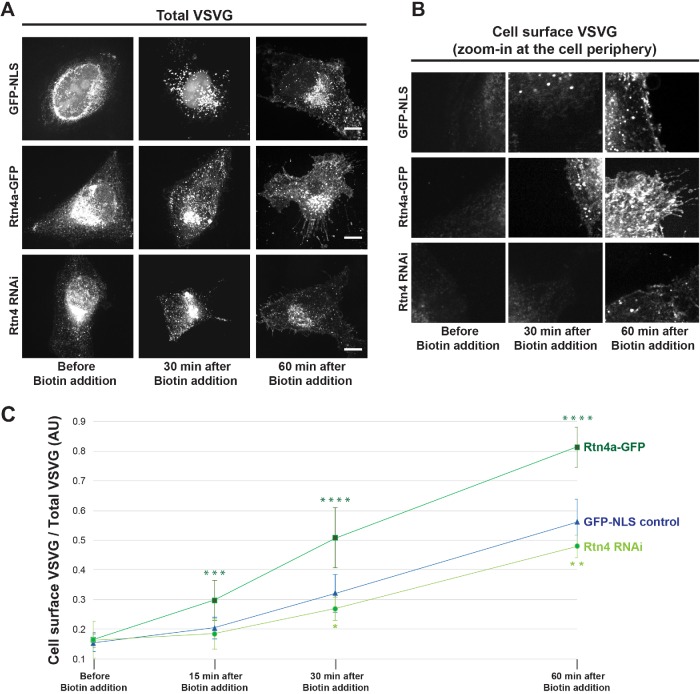
Rtn4a levels modulate the kinetics of VSVG-mCherry trafficking to the cell surface. HeLa cells were transiently cotransfected with a plasmid expressing GFP-NLS as a control, a plasmid expressing Rtn4a-GFP, or siRNA against Rtn4 along with the RUSH construct Str-Ii_VSVG-SBP-mCherry. ER-trapped VSVG was released by addition of 40 µM D-Biotin to the growth media. Cells were fixed before biotin addition and at 15, 30, or 60 min after biotin addition. (A) Representative images of maximum intensity projections of confocal z-stacks showing total VSVG-mCherry. (B) Representative images of single confocal z-planes at the cell periphery to visualize cell surface–localized VSVG-mCherry. (C) Fluorescence intensity of VSVG-mCherry was quantified from the cell surface z-plane and normalized to the total VSVG-mCherry fluorescence intensity measured from the maximum intensity projection of the same cell for 8–12 cells per condition and time point. Scale bars are 10 µm. Error bars represent SD. ****, p ≤ 0.0001; ***, p ≤ 0.001; **, p ≤ 0.01; *, p ≤ 0.05.

