FIGURE 5:
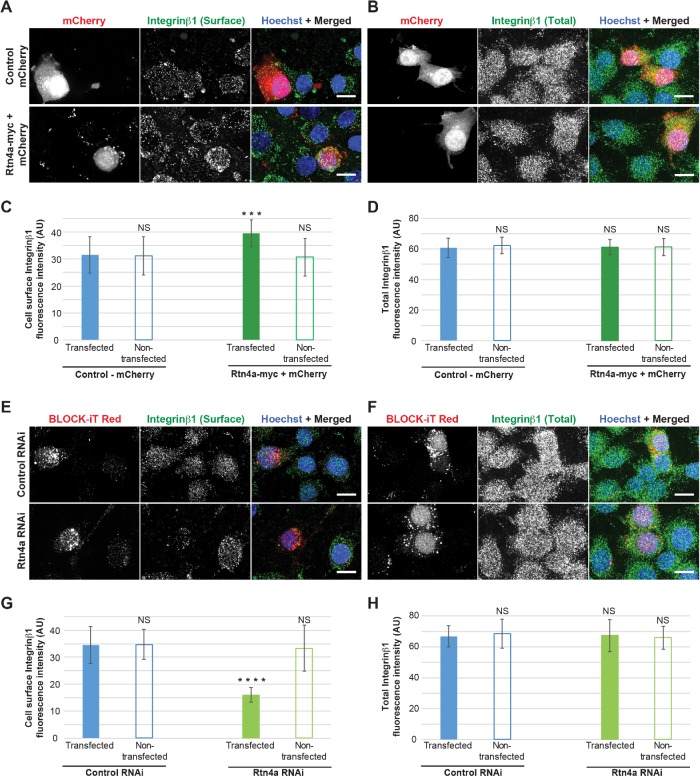
Rtn4a levels modulate cell surface localization of integrin β1 in Neuro-2a cells. (A–D) Undifferentiated Neuro-2a cells were transiently cotransfected with plasmids expressing Rtn4a-myc and mCherry or with mCherry alone as a control. To minimize concerns that the C-terminal GFP tag of Rtn4a-GFP used in other experiments might affect Rtn4a function, here we used the smaller myc tag. (A) Nonpermeabilized cells were stained for surface-localized integrin β1. (B) Permeabilized cells were stained for total integrin β1. (C) Integrin β1 surface fluorescence staining intensity was quantified for 22–30 transfected and nontransfected cells per condition. (D) Total integrin β1 fluorescence intensity was quantified for 18–26 transfected and nontransfected cells per condition. (E–H) Undifferentiated Neuro-2a cells were transiently cotransfected with siRNA specific to Rtn4a and Block-iT fluorescent control or with Block-iT alone. (E) Nonpermeabilized cells were stained for surface-localized integrin β1. (F) Permeabilized cells were stained for total integrin β1. (G) Integrin β1 surface fluorescence staining intensity was quantified for 25–28 transfected and nontransfected cells per condition. (H) Total integrin β1 fluorescence intensity was quantified for 20–24 transfected and nontransfected cells per condition. All representative images are maximum intensity projections of confocal z-stacks. Scale bars are 10 µm. Error bars represent SD. ****, p ≤ 0.0001; ***, p ≤ 0.001; NS, not significant.

