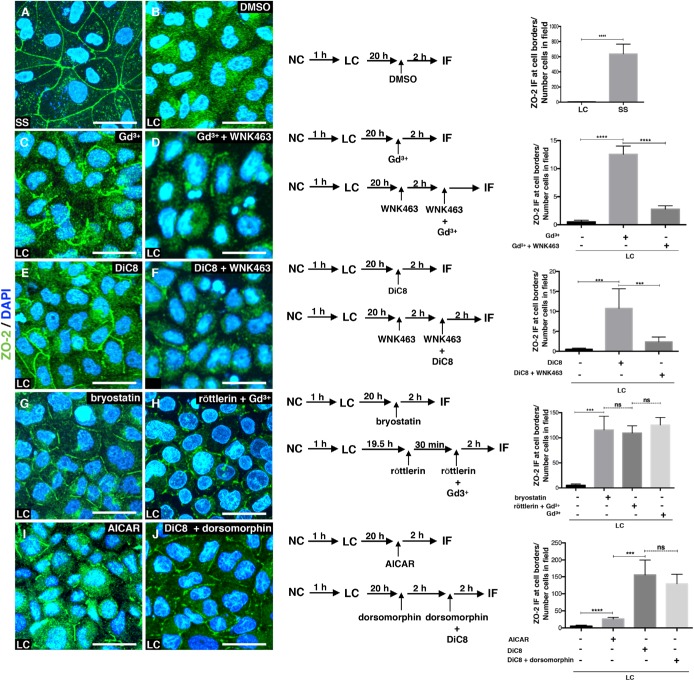
FIGURE 1:
ZO-2 translocates to the cell borders on activation of the CaSR that through the Gαq/11 subunit stimulates PKCε that in turn activates WNK proteins and adenylyl cyclase/AMPK. Monolayers were plated at confluent density and incubated in NC media for 24 h (SS) or for 1 h in NC media and then were transferred to LC for 20 h after which they were treated as indicated in the scheme, with 100 μM Gd3+, an agonist of CaSR; 4 μM WNK463, an inhibitor of WNK proteins; 0.5 mM DiC8, an activator of conventional and novel PKCs; 200 nM bryostatin, an stimulator of nPKC δ and ε; 6 μM röttlerin an inhibitor of nPKCδ; 4 mM AICAR, a stimulator of AMPK; and 50 μM dorsomorphin, an inhibitor of AMPK. Left panels, immunofluorescence images done with an antibody against ZO-2. Nuclei were stained with DAPI. Bars, 20 μm. Images taken from at least two independent experiments. Middle panels, monolayer treatment scheme. Right panels, quantification of ZO-2 fluorescence staining at the cell borders. Statistical analysis was done with Student’s t test ***p < 0.001; ****p < 0.0001; ns, nonsignificant. Results obtained from six optical fields in each experimental condition. Data are from two independent experiments. All the quantitative results in this and the following figures correspond to mean ± SE.

