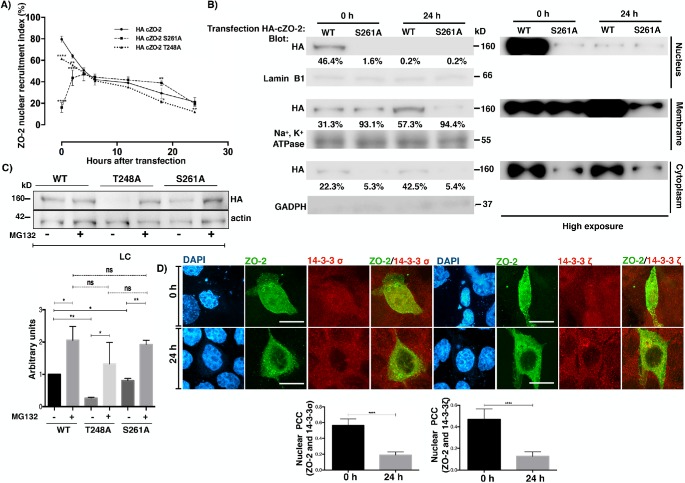
FIGURE 12:
ZO-2 colocalizes with 14-3-3 in the nucleus, and residue S261 of cZO-2 is crucial for the nuclear importation the protein. (A) Left panel, percentage of cells with nuclear HA-ZO-2 as a function of time after transfection, determined by immunofluorescence using an anti HA antibody. Monolayers cultured in NC media were fixed at the indicated times. Time 0 corresponds to 6 h after transfection. Experiments were done with cells transfected with HA-cZO-2 WT, HA-cZO-2 S261A, and HA-cZO-2 T248A. Results are from three independent experiments. In each experiment, 100 transfected cells were evaluated per experimental point. Statistical analysis done with two way ANOVA followed by Bonferroni’s multiple comparison test. cZO-2 S261A and HA-cZO-2 T248A were compared against HA-cZO-2 WT; *p < 0.05; **p < 0.01; ***p < 0.001; ****p < 0.0001. (B) Western blot against HA-ZO-2 present in nuclear, cytoplasmic, and plasma membrane fractions of cells at times 0 and 24 h of transfection with HA-cZO-2 WT and HA-cZO-2 S261A. Antibodies against lamin B1, Na+,K+-ATPase β1 subunit, and GAPDH were employed as markers of nuclear, plasma membrane, and cytoplasmic fractions, respectively. Right panel, overexposed Western blot. (C) The reduced cellular content of HA-cZO-2 mutants T248A and S261A in comparison to WT HA-cZO-2 in LC cultured cells, recovers after proteasome inhibition with MG132. Western blot of cellular lysates derived from monolayers transfected with WT HA-cZO-2 or the mutants T248A and S261A in the presence or absence of 30 μM MG132. Statistical analysis was done with one-way ANOVA followed by Dunnett’s multiple comparisons test, *p < 0.05; **p < 0.01. Results were obtained from three independent experiments. (D) cZO-2-HA colocalized with 14-3-3 σ and ζ in the nucleus at time 0 (6 h after transfection) and this interaction diminished 24 h later. Monolayers were transfected with HA-cZO-2 WT. Immunofluorescence done with antibodies against 14-3-3σ or 14-3-3ζ and anti HA. Top panel, representative images; bottom panel, PCC in the nucleus. Bars, 20 μm. Statistical analysis was done with two-tailed Student’s t test, ****p < 0.0001. Results were obtained from 20 transfected cells per experimental condition from to independent experiments.

