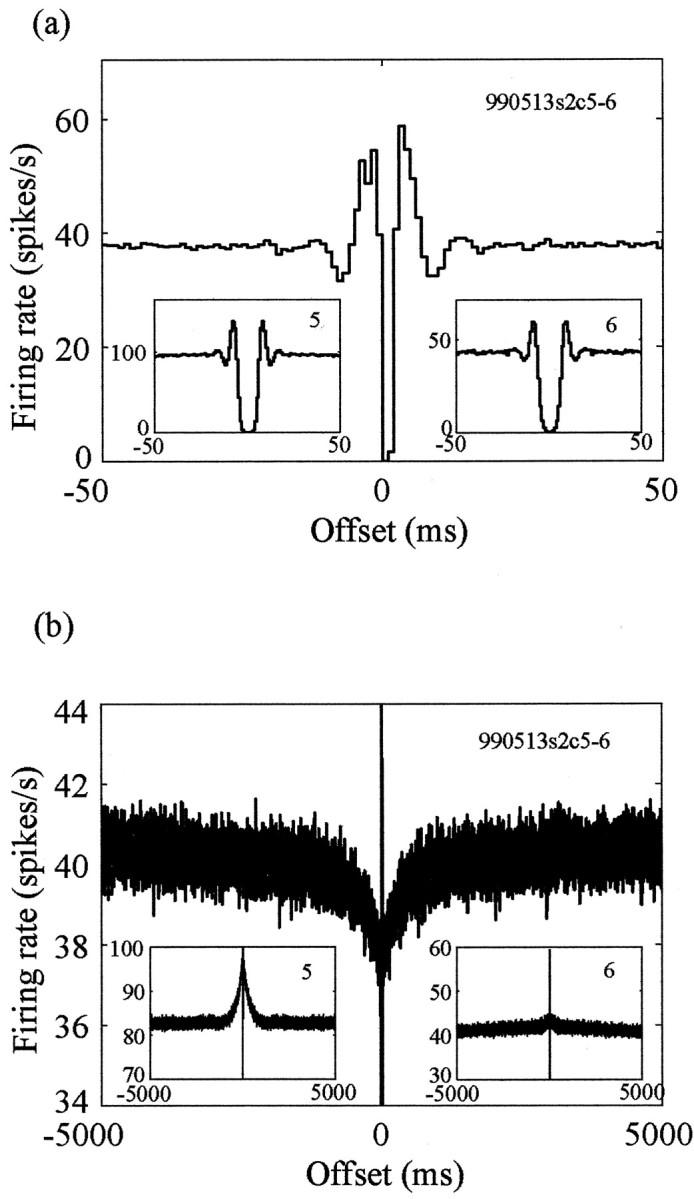
Figure 2.

Observed correlation of two pallidal neurons recorded on the same electrode. a, Short-term (±50 msec) cross-correlogram of the two neurons shown in Figure 1 (990513s2c5-6). The insets contain the autocorrelation functions of the two neurons on the same time scale. b, Long-term (±5000 msec) cross-correlogram and autocorrelation functions of the same neurons. The y-axis (conditional firing rate) scale is enlarged, because the long-term phenomenon is relatively small in magnitude.
