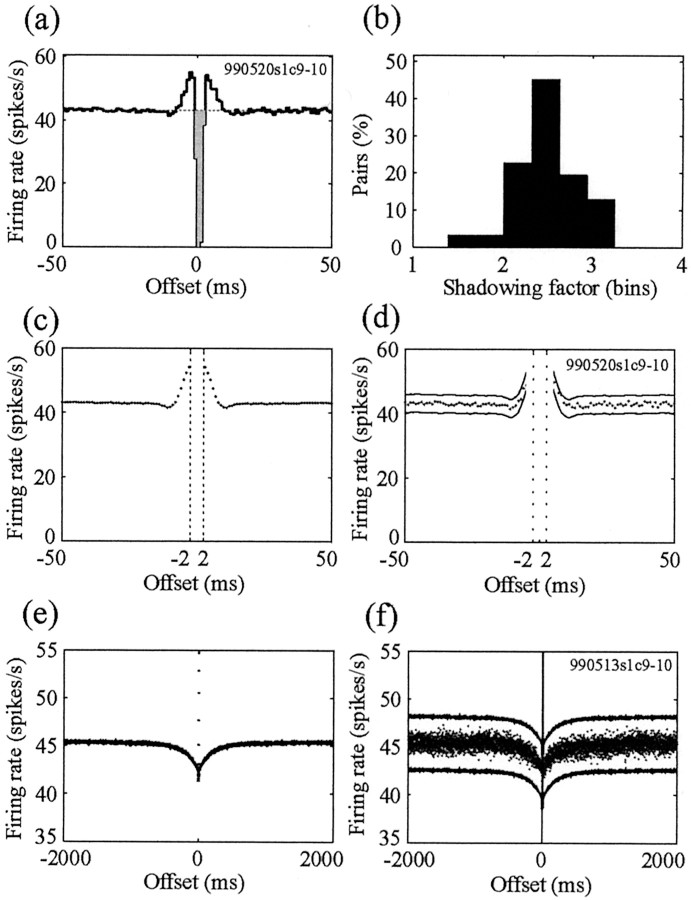
Figure 3.
Compensation for the shadowing effect reveals no correlation between pallidal neurons. a, Estimation of the shadowing factor out of the cross-correlogram (pair 990520s1c9-10) by calculating the areas with decreased correlation around time 0. The shaded area is the shadowing factor (i.e., the area used for the estimation of the shadowing effect). b, Histogram of the shadowing factors calculated for all of the pallidal pairs. c, e, Reconstructed cross-correlograms derived from the compensated autocorrelation functions and the estimated shadowing factor (pair 990520s1c9-10) showing the short-term (±50 msec) shape (c) and long-term (±5000 msec) shape (e). d, f, The recorded cross-correlogram (dots) is shown between the confidence (p < 0.01) limits (solid lines) derived from the reconstructed cross-correlogram for the same pair. The short-term (±50 msec) and long-term (±5000 msec) shape of the correlogram and the confidence limits are shown in d and f, respectively. The vertical dotted lines in c and d are the boundaries of the shadowed areas.

