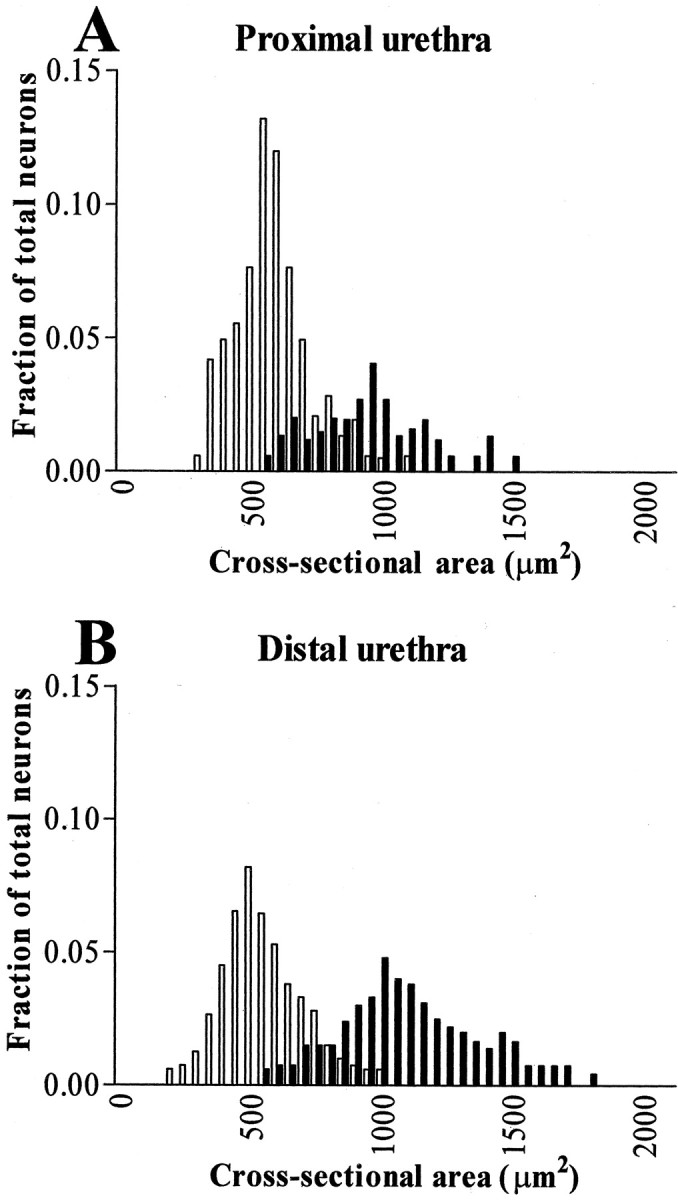
Figure 2.

Histograms of cross-sectional somal areas of L6 and S1 DRG cell profiles innervating the proximal urethra (A) and distal urethra (B). Abscissa indicate a size distribution (cross-sectional somal area) with a bin width of 50 μm2. Ordinate indicates the fraction of total cell population. Open and filled bars represent the fraction of neurofilament-negative and neurofilament-positive cell profiles, respectively.
