
Figure 6.
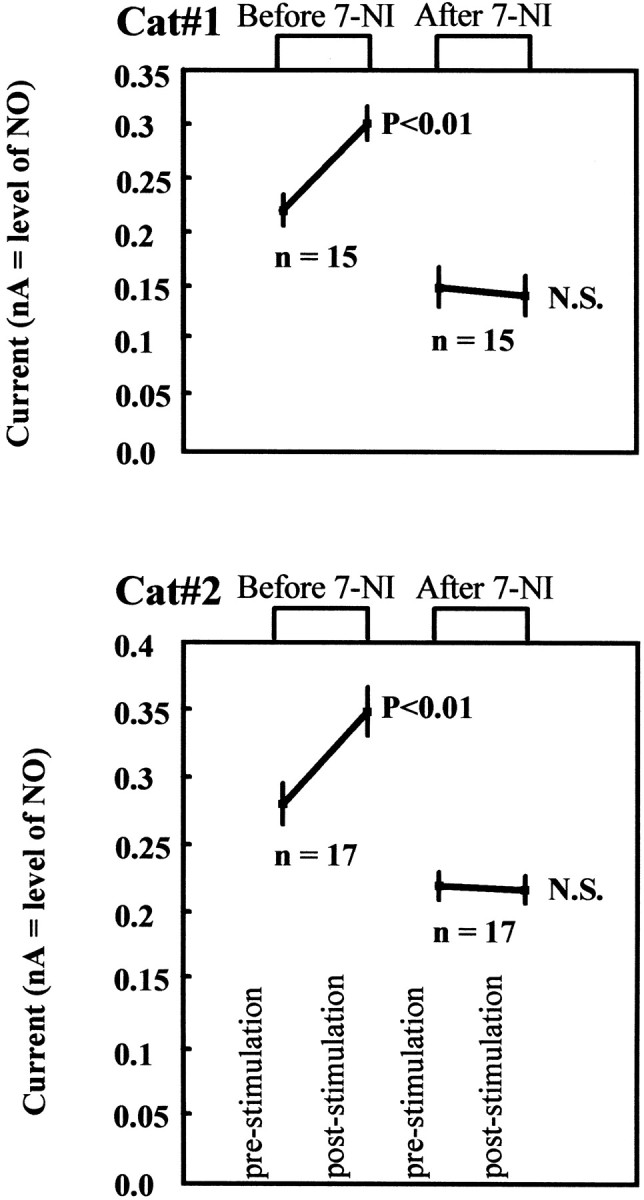
NO cortical levels as measured by voltammetry (full data set). The panels show the mean ± SD of all data points recorded over the 8 hr of the experiment in two cats. Data were obtained under two different conditions, before and after intraperitoneal application of 7-NI. For each condition, the values immediately before electrical stimulation were compared with those obtained immediately after stimulation. The observed changes are statistically significant (Wilcoxon test; p < 0.01) only for the predrug condition.