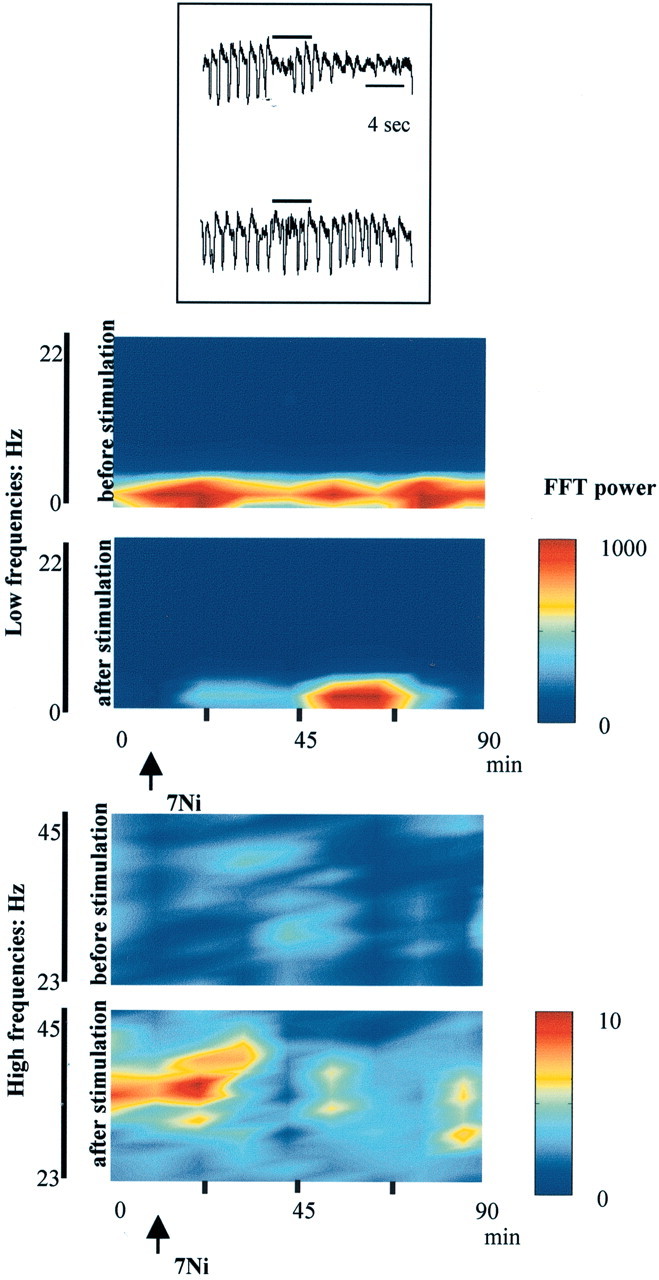
Figure 7.

Time–power relationships throughout 90 min for the frequencies 0–22 Hz (top) and 23–45 Hz (bottom). The graph was computed taking intervals of 10 sec of activity every 10 min and calculating the FFT for every interval. The resulting color-grid was smoothed using an interpolation function. The color bar was adjusted to the power scale. The inset shows two representative traces: control situation (top) and the effect of 7-NI (50 min after injection). Horizontal bars illustrate BF stimulation. See Results for additional details.
