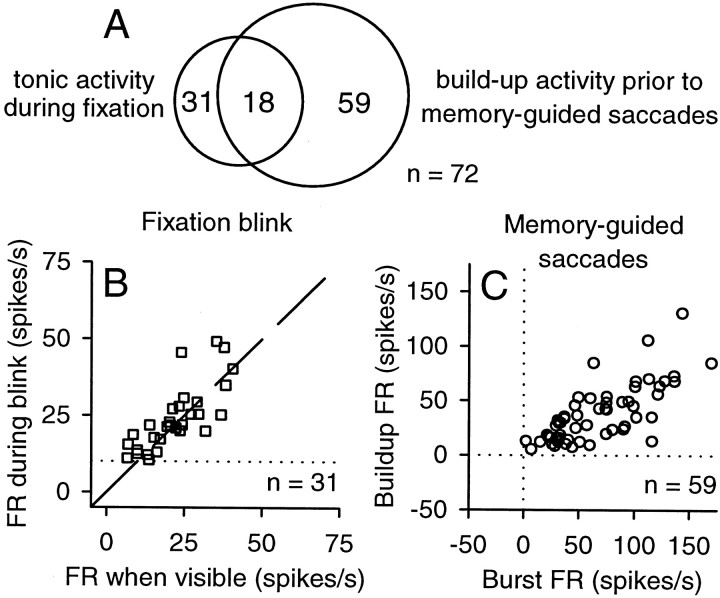
Figure 1.
Classification of neurons reported in this study. A, A Venn diagram illustrating the numbers of neurons identified with fixation-related activity (n = 31) and buildup activity (n = 59). A subset of these neurons (n = 18) exhibited both fixation and buildup activity, for a total of 72 neurons. B, Activity of rostral SC neurons identified as fixation cells during the fixation blink paradigm. The firing rate (FR) during fixation with the target blinked off (a 100 msec interval starting 100 msec after the onset of the blink) is plotted against the firing rate during fixation with the target visible (a 100 msec interval starting 100 msec before the onset of the blink). The dashed line indicates unity slope; the dotted horizontal line indicates 10 spikes per second, which is the criterion minimum firing rate for fixation cells (Munoz and Wurtz, 1993). C, Activity of rostral SC neurons identified as buildup neurons during memory-guided saccades. The buildup firing rate (average activity during a 75 msec interval starting 100 msec before saccade onset) is plotted against the burst firing rate (average activity during an interval spanning 8 msec before saccade onset until 8 msec before saccade end).

