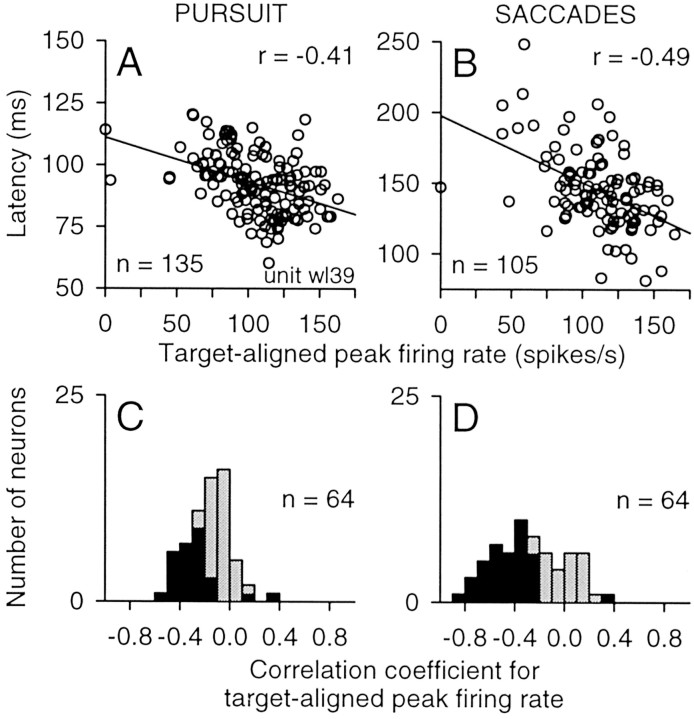
Figure 13.
Correlation between latency and firing rate during the target-aligned interval. A, B, Sample correlations for pursuit (A) and saccades (B) for the same neuron shown in Figure 9. Each symbol indicates a pair of measurements taken from one trial from unit wl39. Straight lines indicate the results from the linear regression analysis, and r values indicate the correlation coefficients. C, D, Summary of the correlation between latency and firing rate during the target-aligned interval. Distributions indicate the range of correlation coefficients obtained across this sample of neurons (n = 64) for pursuit (C) and saccades (D) for targets located in the contralateral visual field. Filled bars indicate significant correlations.

