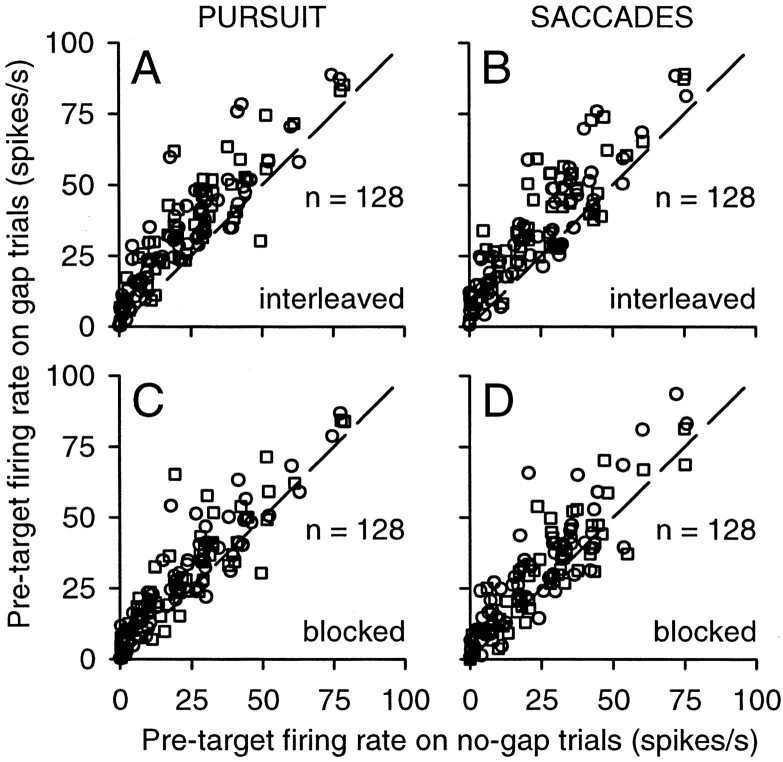
Figure 6.
Changes in tonic activity caused by the gap: comparison with no-gap trials. The average firing rate during the pretarget interval on gap trials is plotted against the average firing rate during the same interval on no-gap trials. Other conventions are the same as in Figure 5.

