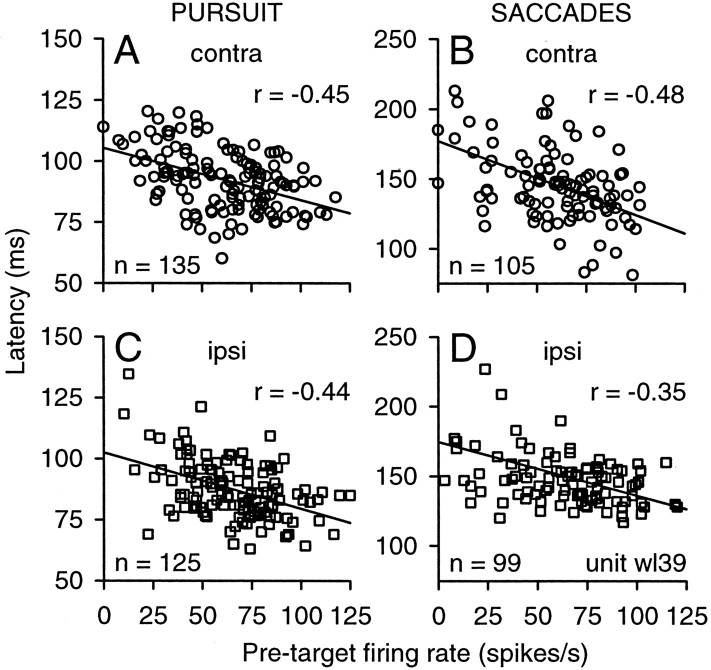
Figure 8.
A–D, Correlation between latency and firing rate during the pretarget interval for pursuit (A, C) and saccades (B, D) for targets located in the contralateral (contra; A, B) or ipsilateral (ipsi; C, D) visual field. Each symbol indicates a pair of measurements taken from one trial from unit wl39. Straight lines indicate the results from the linear regression analysis, and r values indicate the correlation coefficients.

