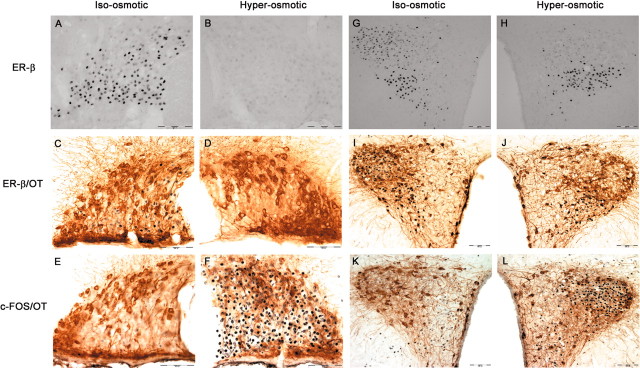
Figure 5.
Photomicrographs of SON (A-F) and PVN (G-L) stained immunocytochemically for ER-β alone (top row), ER-β with oxytocin-neurophysin (OT) (middle row) or FOS with OT (bottom row) from iso-osmotic control rats (iso-osmotic) compared with rats that received 2% hypertonic saline ingestion (hyper-osmotic) for 72 hr. All three staining procedures were performed on adjacent sections, and the representative micrographs depict sections derived from the same rat. Scale bar, 100 μm. OC, Optic chiasm; 3V, third ventricle.

