
Figure 7.
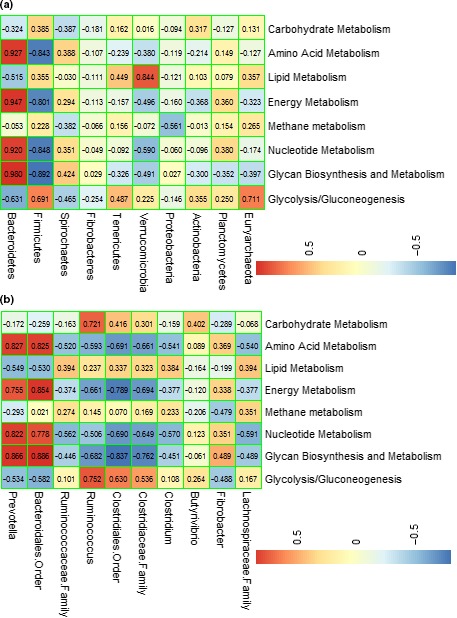
Correlation between the bacterial community and metabolic function. Pearson correlation matrix of the dominant bacteria at the (a) phylum and (b) genus level; the data presented represent the taxa with the top 10 relative abundances in the community. Note. An absolute value of the correlation coefficient >0.5 indicates the existence of correlation (p < 0.05), and that >0.7 indicates a strong correlation (p < 0.01). R: rumen samples; A: abomasum samples; J: jejunum samples; Co: colon samples; Ce: cecum samples