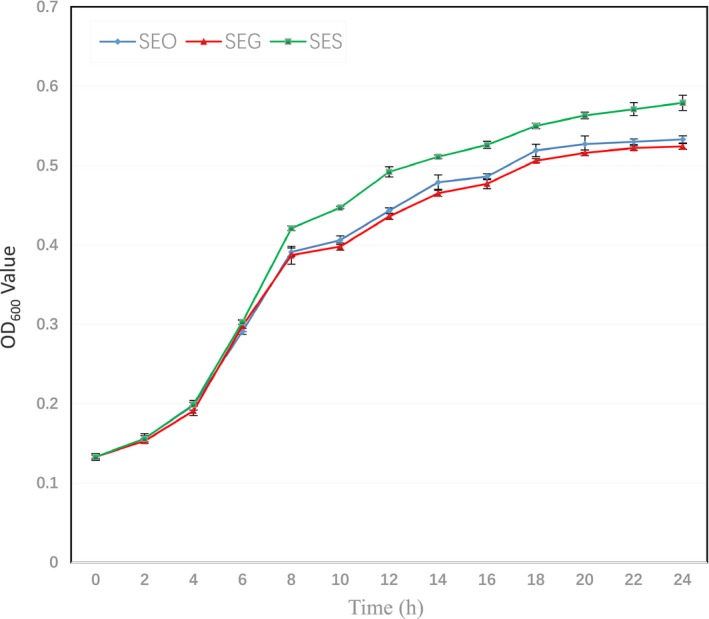
Figure 1.

Growth curves of three S. enteritidis strains. Growth curves of SEO (blue), SEG (red), and SES (green) were determined by measuring the OD600 value, which represents the bacterial concentration. The OD600 value was measured every 2 hr for 24 hr
