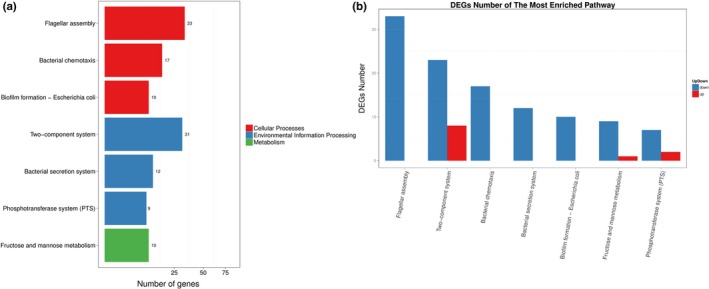
Figure 8.

(a) KEGG pathway enrichment analysis of DEGs. The X‐axis represents the number of DEGs corresponding to the KEGG pathway. The Y‐axis represents the KEGG pathway. (b) KEGG pathway enrichment analysis of upregulated and downregulated DEGs. The X‐axis represents the KEGG pathway. The Y‐axis represents the number of DEGs corresponding to the KEGG pathways. Blue represents downregulated DEGs, and red represents upregulated DEGs
