
Figure 9.
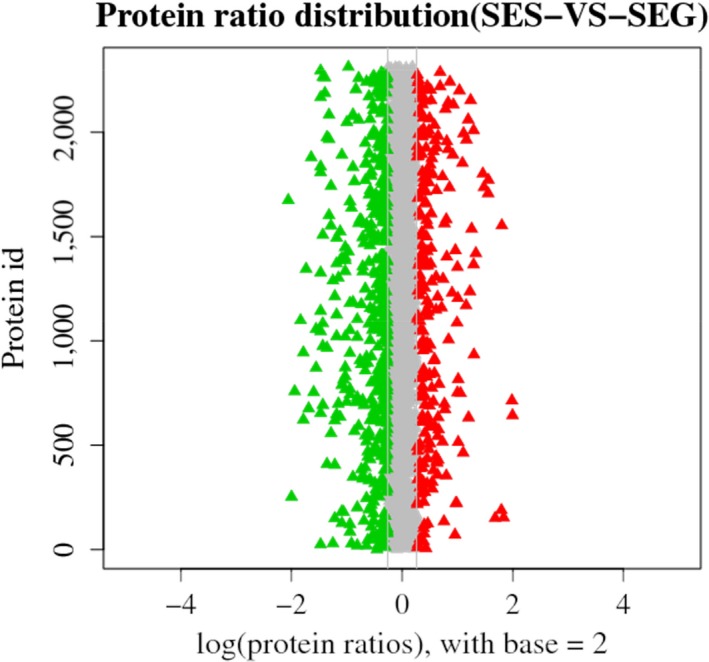
Protein ratio distribution between the SEG and SES strains. The distribution of the average protein quantification value is shown. Red triangles represent upregulated proteins, and green triangles represent downregulated proteins
Official websites use .gov
A
.gov website belongs to an official
government organization in the United States.
Secure .gov websites use HTTPS
A lock (
) or https:// means you've safely
connected to the .gov website. Share sensitive
information only on official, secure websites.
Protein ratio distribution between the SEG and SES strains. The distribution of the average protein quantification value is shown. Red triangles represent upregulated proteins, and green triangles represent downregulated proteins