
Figure 10.
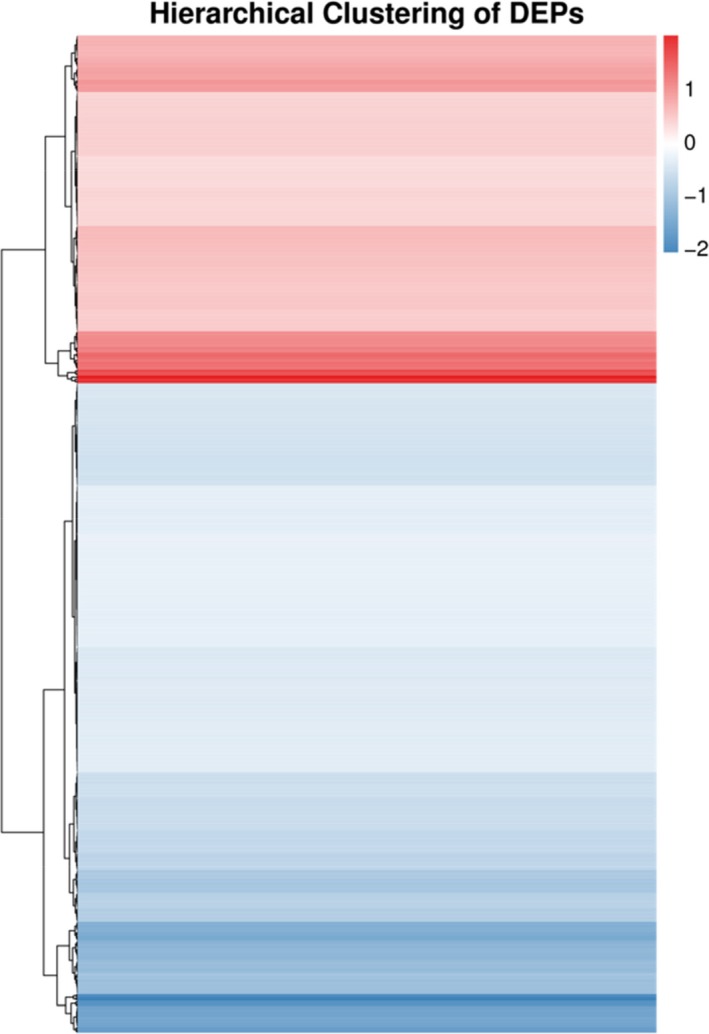
Hierarchical clustering analysis of DEPs. Blue bars represent the downregulated proteins, red bars represent the upregulated proteins, and white bars represent the proteins there did not change significantly
Official websites use .gov
A
.gov website belongs to an official
government organization in the United States.
Secure .gov websites use HTTPS
A lock (
) or https:// means you've safely
connected to the .gov website. Share sensitive
information only on official, secure websites.
Hierarchical clustering analysis of DEPs. Blue bars represent the downregulated proteins, red bars represent the upregulated proteins, and white bars represent the proteins there did not change significantly