Figure 12.

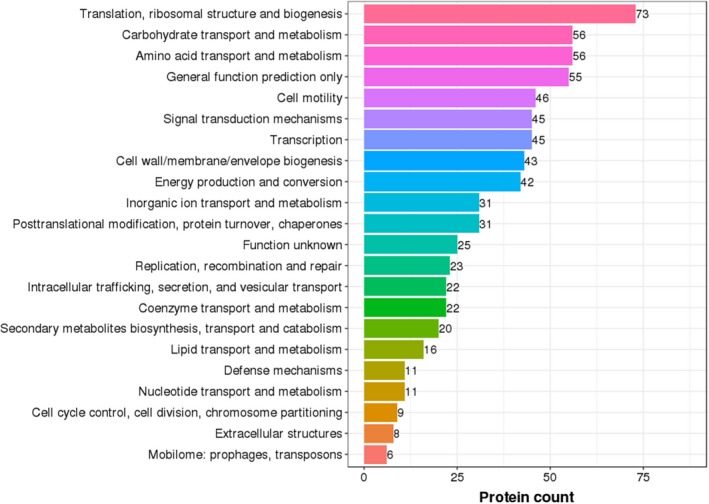
COG function classification of DEPs. The X‐axis represents the number of DEPs according to the COG function class. The Y‐axis represents the COG function class

COG function classification of DEPs. The X‐axis represents the number of DEPs according to the COG function class. The Y‐axis represents the COG function class