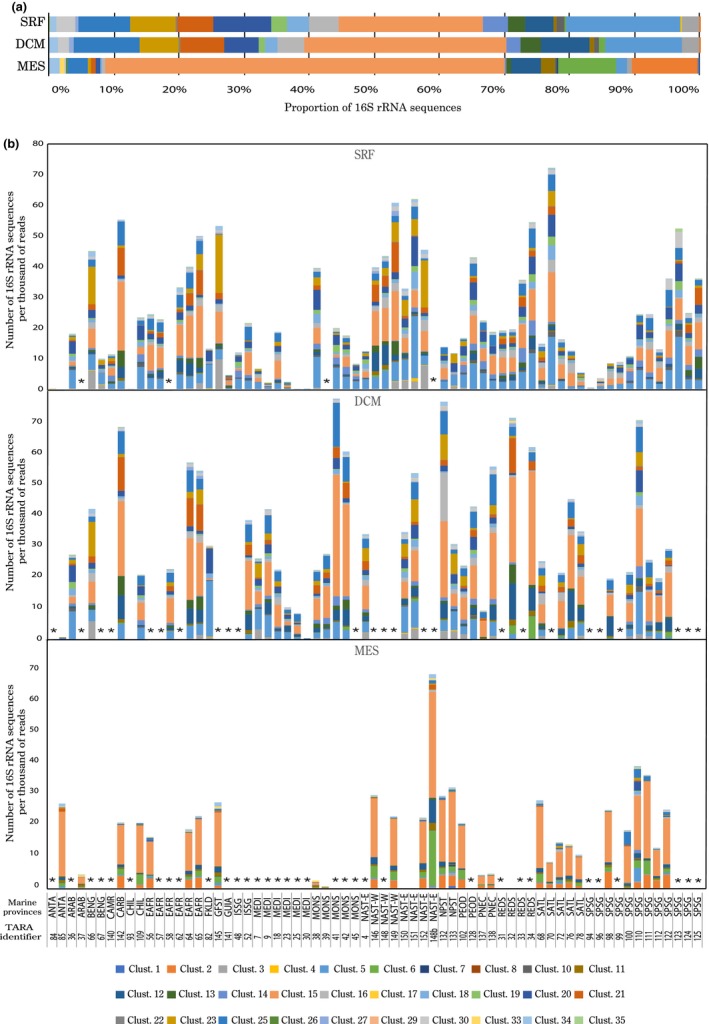
Figure 3.

Average proportion of the different MGII clusters in the surface (SRF), deep chlorophyll maximum (DCM), and mesopelagic zone (MES) of the global ocean (a) and in all the Tara Oceans samples (b)

Average proportion of the different MGII clusters in the surface (SRF), deep chlorophyll maximum (DCM), and mesopelagic zone (MES) of the global ocean (a) and in all the Tara Oceans samples (b)