
Figure 4.
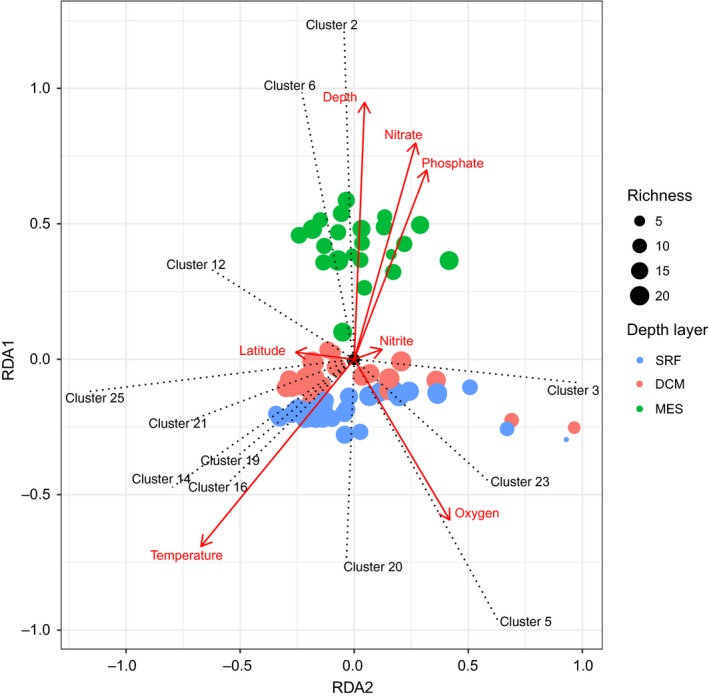
Ordination plot of the partial Redundancy Analysis (pRDA) ran on the MGII cluster abundance matrix. Physicochemical parameters were included as co‐variables. Arrows represent the parameters that explain the ordination. Dotted lines show the main clusters contributors. Colors represent depth layers: surface (SRF), deep chlorophyll maximum (DCM), and mesopelagic zone (MES)