
Figure A5.
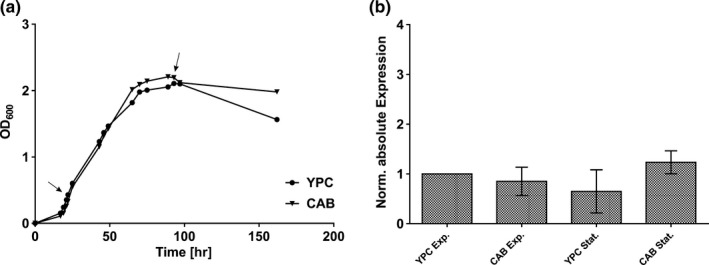
Comparison of dacZ transcription in Haloferax volcanii wild type grown under normal conditions in rich YPC and selective CAB medium. (a) Growth curves of wild type in YPC and CAB medium. Figure represents one of three biological replicates with similar results. Curves represent mean of three technical replicates. Arrows indicate time points of cell material sampling for RNA extraction. (b) Normalized absolute expression levels of dacZ in wild type grown in YPC and CAB medium. Column values represent average of three biological replicates with three technical replicates each. Error bars indicate standard deviation. Absolute expression was calculated using a standard curve of Cq‐values obtained for a defined amount of dacZ target sequence. Absolute expression levels for conditions YPC stationary growth and CAB exponential and stationary growth were normalized to expression in YPC exponential cells (set to 1). (Exp.: exponential; Stat.: stationary)