
Figure 5.
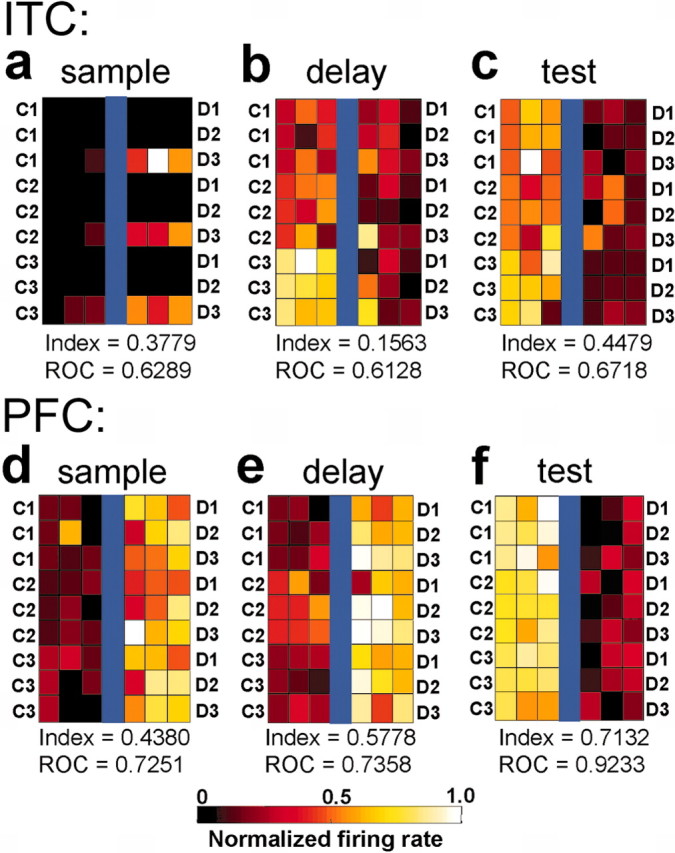
Neuronal responses to individual sample stimuli. These six color plots show the average activity of three ITC (a–c) and three PFC (d–f) neurons to stimuli along each of the nine between-class morph lines (Fig. 1). Conventions are the same as the color plots in Figure 4. The category index of each neuron and ROC values are indicated below each color plot. The plots are arranged into three columns. The columns, from left to right, show examples of neurons with selective activity during the sample, delay, and test epochs, respectively. These plots show the activity of six different neurons and not the activity of an individual neuron from each area across time.