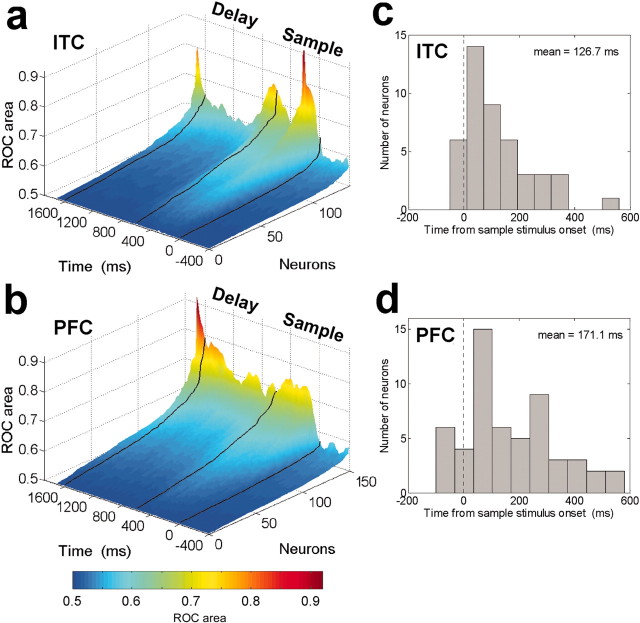
Figure 9.
Time course of category sensitivity. The activity of 141 category-sensitive ITC (A) and 156 category-sensitive PFC (B) neurons was computed using a sliding ROC analysis at 10 msec steps (see Materials and Methods). ROC values were sorted independently for each time bin. Higher ROC values indicate better discrimination between categories (0.5 = no discrimination, 1.0 = perfect discrimination). The black lines correspond (from right to left) to sample onset, offset, and test stimulus onset. Time is aligned to the midpoint of the sliding window (i.e., values at time = 0 indicate the ROC values during the -100 to 100 msec time epoch relative to sample onset). C and D show the distribution of the latencies for neurons to begin to distinguish between categories (as computed by ROC) for 119 ITC (C) and 90 PFC (D) neurons that were category sensitive during the sample epoch.

