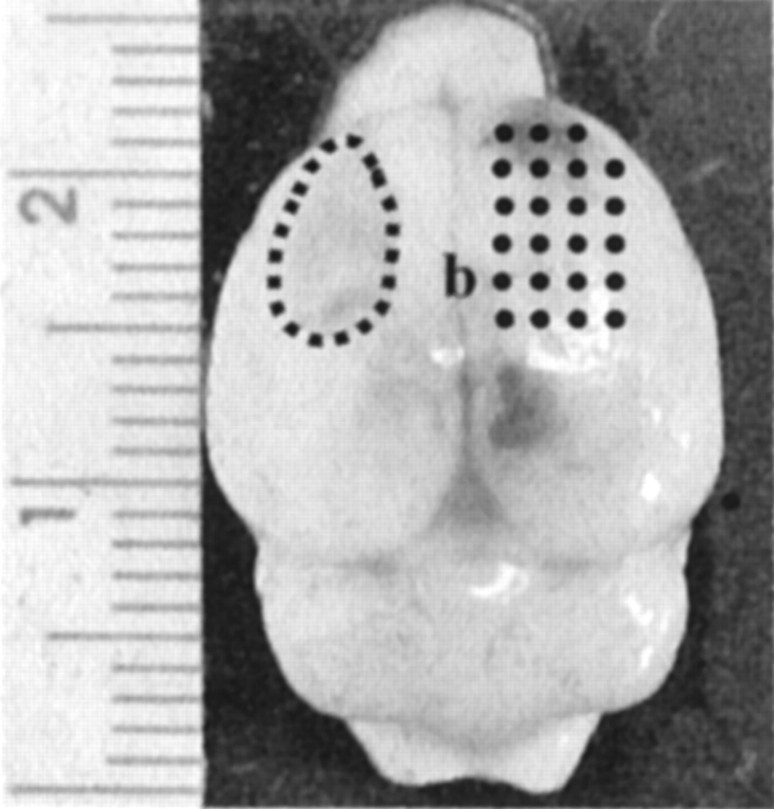
Figure 1.
Dorsal view of a rat brain 6 weeks after aspiration lesion surgery and mAb IN-1 treatment. The typical size and location of an aspiration lesion cavity is outlined in the left hemisphere (dotted line). The points on the right hemisphere indicate the area of intracortical microstimulation. The ruler indicates millimeter increments; b, bregma landmark.

