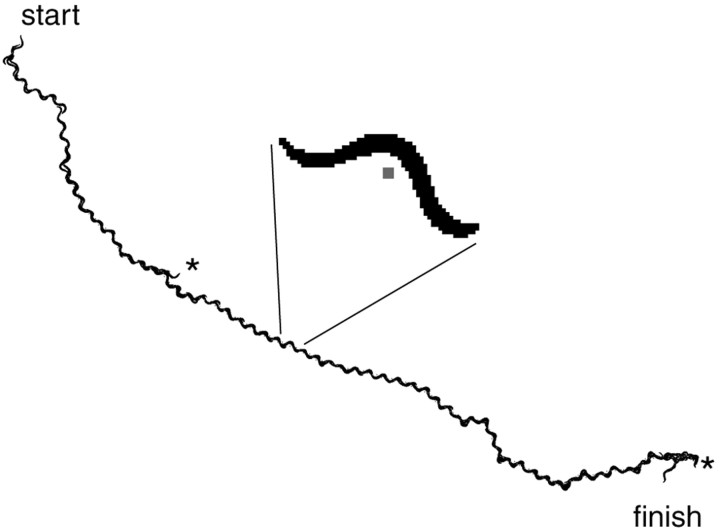
Figure 2.
Reconstructed path of a tracked animal. Every second for 200 sec the individual silhouettes were captured, and the X and Y coordinates of centroid were calculated. The coordinates of the centroid associated with each silhouette were used to reassemble the silhouettes into the path followed by the animal. The inset shows a blowup of the image from a single time point from the series. The centroid is indicated by the small gray square. Asterisks indicate reversals that occurred at 47 and 192 sec.

