Figure 6.

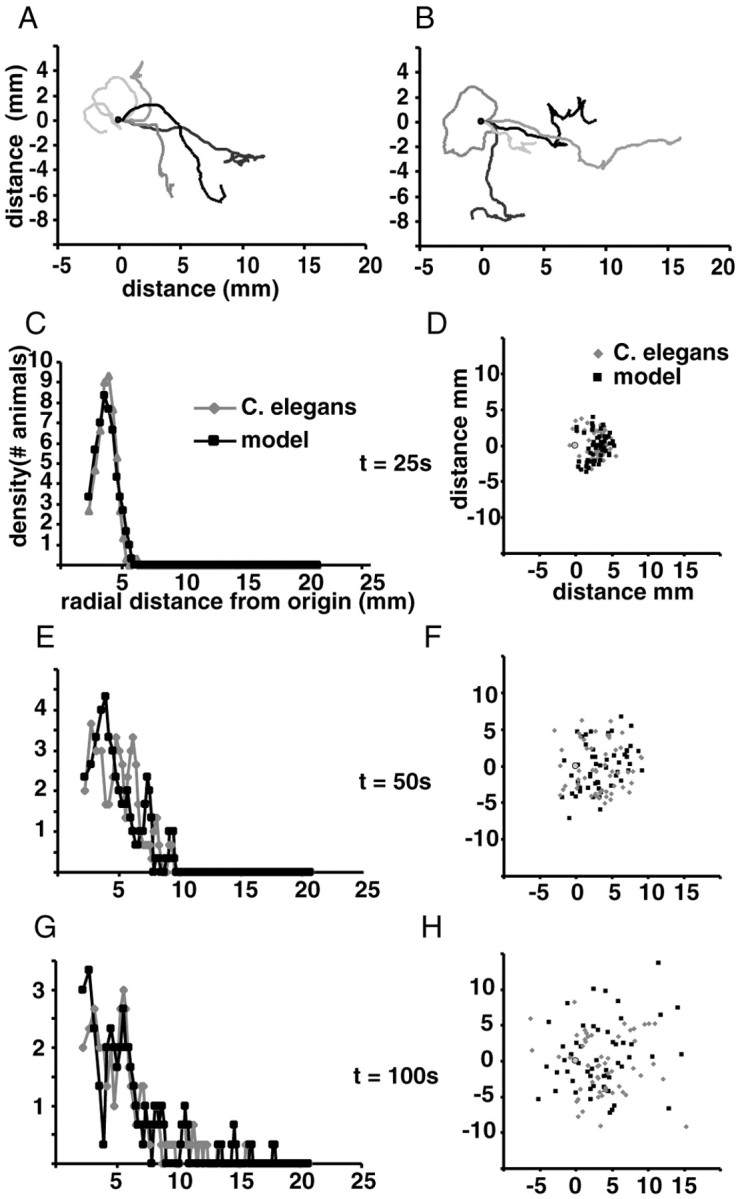
Comparison of the locomotion model with the behavior of real animals. A, B, Traces of real animals and model animals, respectively. Five traces of real animals were chosen at random, and five traces of similar overall form were chosen from a set of 53 model animals. Traces were normalized so animals begin the trace moving to the right from the origin (0,0). C, E, G, Density histogram of radial distance from the origin of real (gray diamonds) and modeled (black squares) animals at 25, 50, and 100 sec into the experiment, respectively. The radii defining bins in the radial dispersion histogram are normalized so that each bin defines a constant area (i.e., the area of the donut whose inner and outer radii are determined by the limits of the bin). The distribution has been smoothed by averaging three consecutive bins. D, F, H, Each animal is plotted according to its X and Y coordinates at 25, 50, and 100 sec, respectively, from the beginning of the experiment. Each real animal is indicated by a gray diamond, and each modeled animal is indicated by a black square. The gray circle indicates the origin.
