Figure 7.
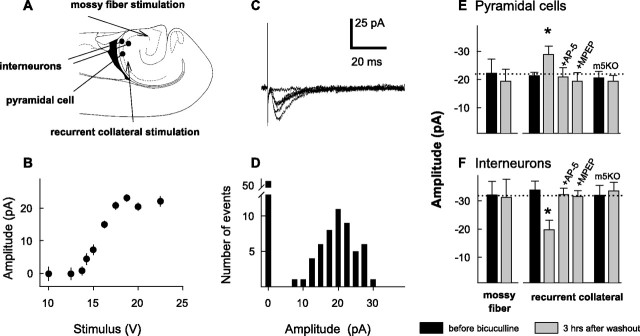
Evoked EPSCs before and 3 hr after bicuculline washout A, Diagram of the slice preparation indicating the sites of the recordings (filled circles) and stimulation (arrows). B, Plot of EPSC amplitudes at different stimulus intensities (n = 5 measurements per point) from a representative experiment. C, Example traces of evoked EPSCs recorded in a CA3 pyramidal cell after minimal stimulation of the recurrent collaterals. D, Amplitude histogram from the same experiment illustrated in B and C. E, F, Mean amplitudes of the minimal evoked EPSCs recorded from pyramidal cells (E) and interneurons (F) before (black columns) and 3 hr after bicuculline (20 μm) washout (gray columns). All data were obtained from wild-type mice, except for the columns that indicated m5KO, which were from mGluR5-KO mice. +AP-5 and +MPEP indicate treatments with AP-5 (100 μm) and MPEP (50 μm). All experiments were performed at a holding potential of –70 mV. The drugs were applied 30 min before and kept throughout the 1 hr bicuculline incubation (n = 5–20 cells per bar). The stimulated pathways are indicated below the columns in F (*p < 0.05; ANOVA).

